Forex Signals Brief June 12: Less Attention on US PPI After Yesterday ‘s Soft CPI Inflation
The Producer Price Index (PPI), a key measure of wholesale inflation, is back in focus as investors react to fresh trade developments...
•
Last updated: Wednesday, June 11, 2025
Quick overview
- The Producer Price Index (PPI) is gaining attention as investors respond to new trade developments and inflation data.
- President Trump announced that China will supply rare earths and allow Chinese students into U.S. institutions, despite ongoing tariffs.
- The U.S. Consumer Price Index (CPI) showed a slight easing in inflation, but tariff pressures continue to be a concern.
- Oil prices spiked due to security concerns in the Middle East, while gold and cryptocurrencies experienced mixed trading patterns.
The Producer Price Index (PPI), a key measure of wholesale inflation, is back in focus as investors react to fresh trade developments, inflation data, and shifting global market sentiment.
US-China Trade Reengagement: Rare Earths, Students, and Tariffs
President Trump announced that China will begin supplying rare earths and essential industrial magnets as part of the updated Geneva agreement, finalized last month. Additionally, Chinese students will again be allowed entry into U.S. academic institutions.
Despite partial trade resets, the U.S. remains subject to a 55% tariff load from China—broken down as 25% from Trump’s first term, 20% from his current administration, and 10% attributed to a fentanyl-related penalty.
US CPI Eases, But Tariff Pressures Remain in Focus
The U.S. Consumer Price Index (CPI) was another key data release of the day. Headline CPI rose 2.4% YoY, a slight deceleration from the prior 2.9%, and just under the 2.5% estimate. Monthly CPI edged up 0.1% (+0.081% unrounded), below expectations.
Core CPI rose 0.1% m/m (+0.130% unrounded), and 2.8% YoY, slightly under the forecast of 2.9%, reflecting continued disinflation. Tariff-driven inflation concerns, however, haven’t fully materialized yet.
The softer inflation figures led to a drop in U.S. yields and the USD, although initial stock gains reversed as markets closed lower.
Oil Spikes on Security Concerns in Middle East
Late in the day, the U.S. advised military families to leave parts of the Middle East due to escalating security risks. This added to upward pressure on oil prices.
Crude closed at $68.07, marking its highest price since April 3—even as global equity markets ended in the red.
Wednesday Forex Outlook – PPI Preview: Rebound Expected After Sharp Decline
The headline PPI m/m is expected to rise 0.2% (previous: -0.5%), while core PPI is seen at 0.3% (previous: -0.4%). This follows one of the sharpest drops in years.
According to Wells Fargo, core goods prices rose 0.4%, double the average of the last two years, suggesting companies may be passing rising input costs down the supply chain.
Last week, markets were slower than what we’ve seen in recent months, with gold retreating as a result, the EUR/USD jumping close to 1.15 but returned back to 1.14 this week, and stock markets continued upward too. The moves weren’t too big, but we opened 37 trading signals in total, finishing the week with 25 winning signals and 12 losing ones.
Gold in Tight Range, but Key Levels in Play
Gold continues to consolidate, trading near $3,255, supported by the 50-day SMA. A break above $3,400 could pave the way for a retest of the April high at $3,500. A drop below $3,120, on the other hand, might trigger safe-haven buying once again.
USD/JPY Runs into the 50 Daily SMA
Despite falling U.S. Treasury yields, USD/JPY climbed from 143.40 to 144.31. Analysts attribute the move to Japanese capital outflows and global portfolio reallocations, showing how geopolitical and flow-driven dynamics are overriding typical rate-based moves.
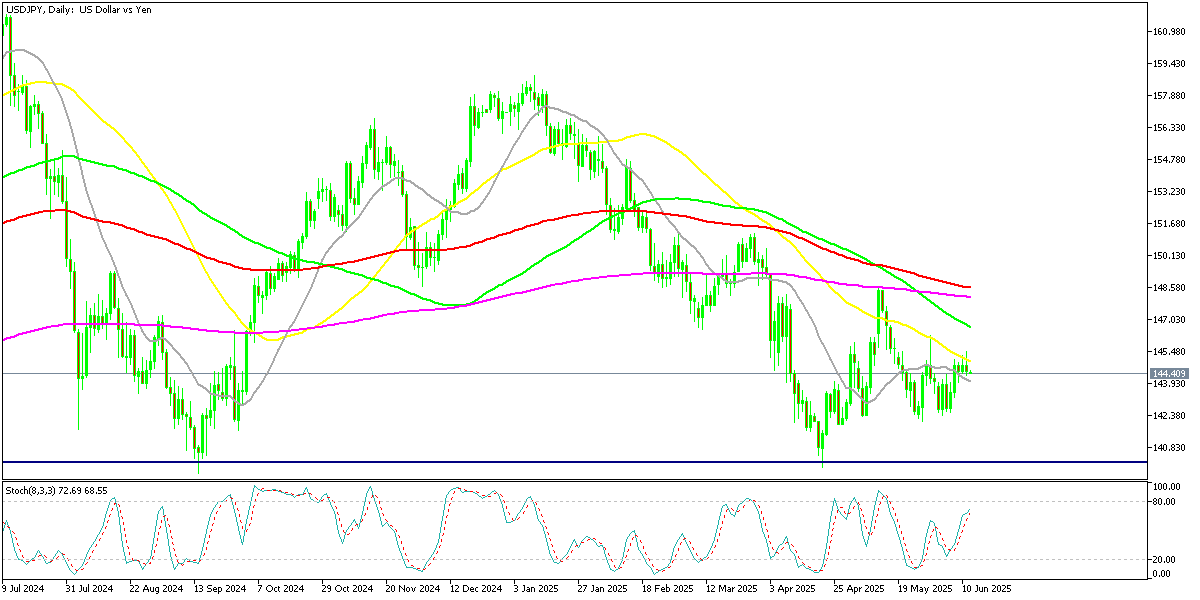
USD/JPY – Daily Chart
Cryptocurrency Update
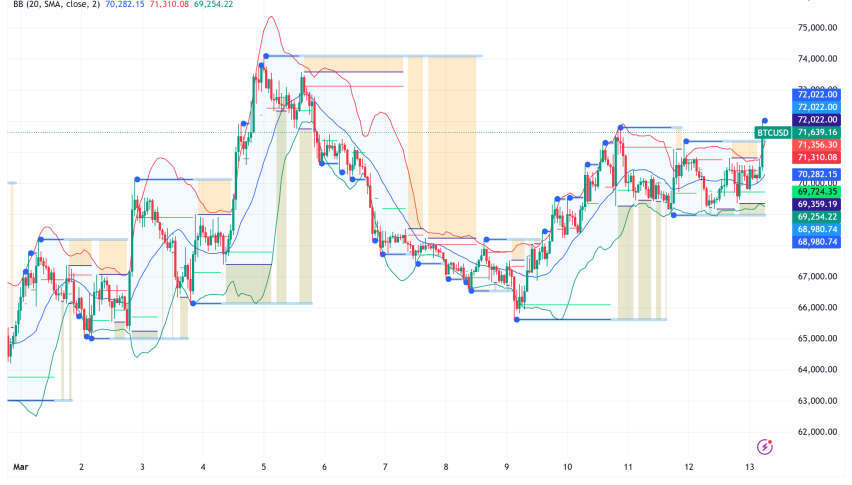
Bitcoin and Ethereum Reflect Broader Macro Anxiety
Bitcoin surged past the $110,000 mark earlier in the week, gaining over 6% as investors sought alternatives amid geopolitical tension, rising debt levels, and U.S. economic uncertainty. However, the rally lost steam at the 20-day moving average, with BTC sliding back to around $100,000.
BTC/USD – Daily chart
Ethereum Retests the 200 SMA
Ethereum also participated in the uptrend, gaining over 20% since April, supported by renewed institutional enthusiasm following the successful rollout of the Pectra upgrade. The enhancement—focused on improving wallet functionality and staking operations—has added both technical momentum and longer-term utility appeal to Ether. Nonetheless, the 200-day SMA remains a key resistance level, with ETH/USD seeing rejection from that threshold in its latest attempt to climb higher.
ETH/USD – Daily Chart
- Check out our free forex signals
- Follow the top economic events on FX Leaders economic calendar
- Trade better, discover more Forex Trading Strategies
- Open a FREE Trading Account
- Read our latest reviews on: Avatrade, Exness, HFM and XM
ABOUT THE AUTHOR
See More
Skerdian Meta
Lead Analyst
Skerdian Meta Lead Analyst.
Skerdian is a professional Forex trader and a market analyst. He has been actively engaged in market analysis for the past 11 years. Before becoming our head analyst, Skerdian served as a trader and market analyst in Saxo Bank's local branch, Aksioner. Skerdian specialized in experimenting with developing models and hands-on trading. Skerdian has a masters degree in finance and investment.
Related Articles

Sidebar rates
Related Posts
