WTI Crude Oil (USOIL) Hits $68.99 Before Cooling—4 Key Levels Traders Are Watching Now
WTI crude oil futures hit a 2 month high of $68.99 on Thursday as geopolitical risk and supply concerns rose. Tensions between the US...

Quick overview
- WTI crude oil futures reached a two-month high of $68.99 amid rising geopolitical risks and supply concerns.
- Tensions between the US and Iran escalated, contributing to volatility in the energy market.
- US-China trade talks provided relief, potentially stabilizing global trade and supporting energy demand.
- Traders should monitor key support levels and MACD indicators for potential entry points in the market.
WTI crude oil futures hit a 2 month high of $68.99 on Thursday as geopolitical risk and supply concerns rose. Tensions between the US and Iran escalated as Washington evacuated some personnel from the Middle East after Iran threatened to target US bases if nuclear talks collapse. This added to the already volatile energy market.
Meanwhile, trade relief came from US-China talks as the two sides agreed on a new framework to ease tariffs and stabilize global trade – good news for sustained energy demand from the world’s two biggest oil consumers.
Macros are also bullish. US inflation cooled to 2.4% annually, so the Fed may cut rates by September. The rate sensitive crude market liked this and EIA reported a 3.6 million barrel drop in US oil inventories – twice as much as expected and tightened supply.
USOIL Key Levels to Watch
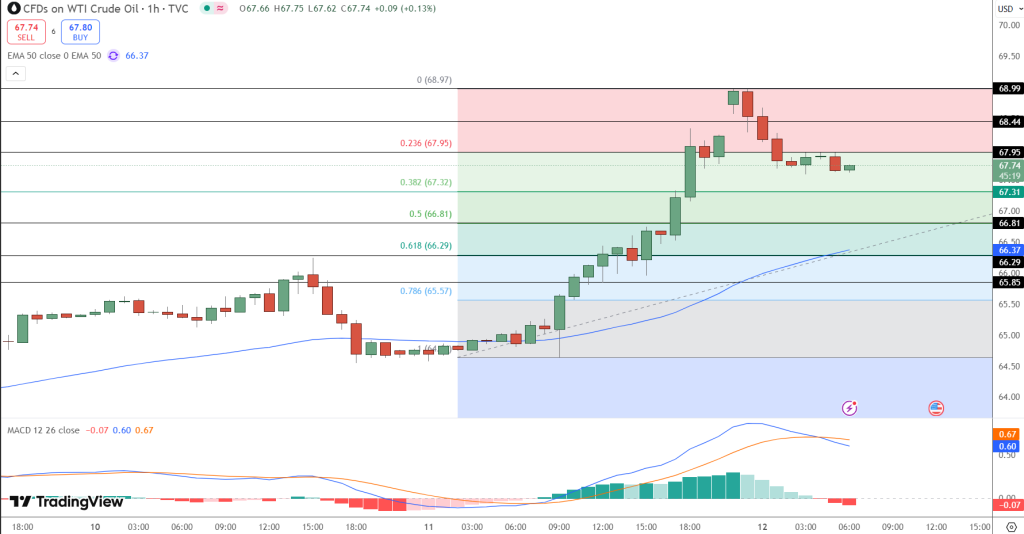
WTI is pulling back from $68.99. On the 1 hour chart, the pullback is hitting several key Fibonacci support zones.
Support zones:
- 38.2% Fibonacci: $67.32
- 50% retracement & confluence: $66.81
- 50-EMA support: $66.37
- 61.8% Fibonacci: $66.29
Despite the pullback, WTI is above the breakout structure and 50 period EMA so the bigger trend is still up. A break below $66.29 could expose $65.57 (78.6% Fib) and threaten the uptrend.
MACD is flashing caution. The histogram is red and the MACD line has crossed below the signal line – early sign of weakening momentum. Until buyers can reclaim with volume, this pullback should be respected.
Crude Oil Trade Setup and Strategy
For traders:
- Entry: Wait for a bounce above $67.32 or breakout above $67.95
- Stop-loss: Below $66.20 (under trend support)
- Targets: $68.44 and $68.99
- Risk Level: Moderate, given MACD’s bearish bias
Summary:
WTI crude’s rally may have hit a short-term ceiling, but the broader bullish backdrop remains. Geopolitical tension, lower inventories, and Fed rate cut expectations offer tailwinds. A bounce from $67.32 or breakout past $67.95 could set the stage for a renewed push toward $69. Traders should watch for volume and MACD reversal for confirmation.
- Check out our free forex signals
- Follow the top economic events on FX Leaders economic calendar
- Trade better, discover more Forex Trading Strategies
- Open a FREE Trading Account
- Read our latest reviews on: Avatrade, Exness, HFM and XM