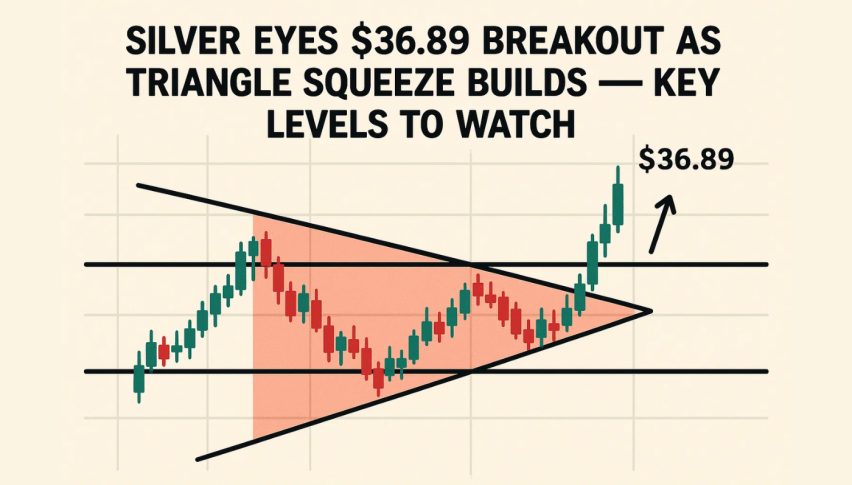
Silver Eyes $36.89 Breakout as Triangle Squeeze Builds—Key Levels to Watch
Silver (XAG/USD) is in focus as Israel and Iran tensions ripple through global markets. While gold has taken centre stage, silver
Quick overview
- Silver (XAG/USD) is gaining attention amid rising tensions between Israel and Iran, which are impacting global markets.
- The metal is currently trading within a symmetrical triangle pattern, indicating a potential breakout as volatility decreases.
- Investors are anticipating a Federal Reserve meeting this week, with expectations of steady rates and potential rate cuts by year-end boosting silver's appeal.
- A breakout above $36.40 could lead to further gains, while a drop below $36.02 may signal a bearish trend.
Silver (XAG/USD) is in focus as Israel and Iran tensions ripple through global markets. While gold has taken centre stage, silver – often the secondary safe-haven asset – is quietly setting up for a big move.
After a volatile weekend of military strikes and rising fears of escalation, investors are bracing for broader market chaos. The conflict has prompted safe-haven bids into metals, including silver, especially after US President Donald Trump said: “Sometimes countries have to fight it out first.”
Meanwhile, investors are also watching this week’s Federal Reserve meeting where rates are expected to be steady. But market participants have already priced in two rate cuts by year-end due to easing inflation. Lower yields boost precious metals by reducing the opportunity cost of holding non-yielding assets like silver.
Silver Compresses Inside Symmetrical Triangle
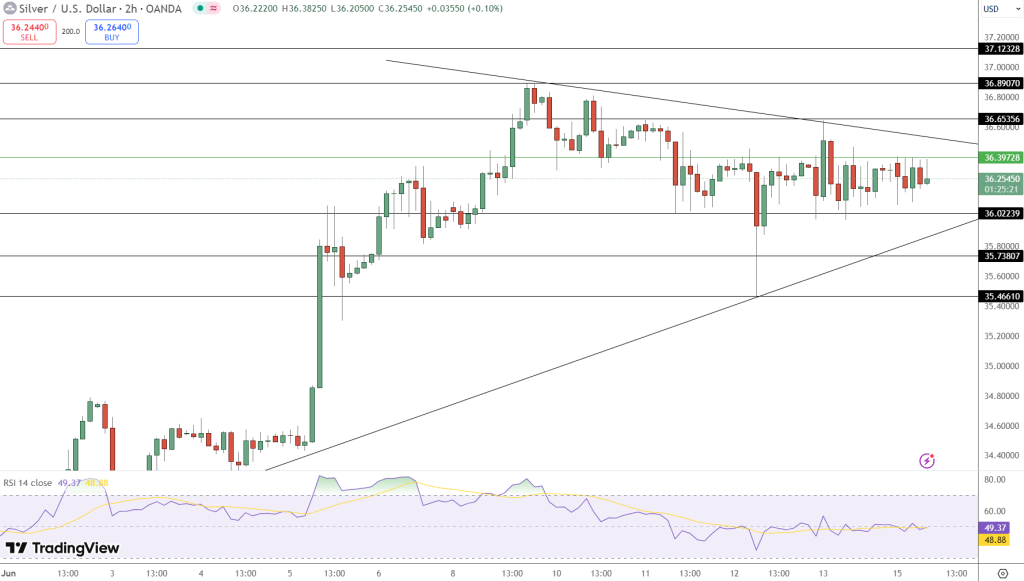
Technically, silver is in a well-defined symmetrical triangle, with price action compressing between descending resistance at $36.89 and ascending support above $35.46. The tighter the range the closer to a breakout.
Currently at $36.25, silver is in a tight band between resistance at $36.39 and support at $36.02. Doji candles and spinning tops show indecision among traders while RSI is at 49, neutral momentum.
This kind of low volatility often precedes big moves. All it needs is a catalyst – be it geopolitical escalation, a Fed surprise or a break of key levels.
Breakout Trade Setup: What to Watch
A breakout from the triangle could offer short-term traders a directional trade:
- Bullish breakout above $36.40 opens up to $36.65 and $36.89
- Bearish breakdown below $36.02 could target $35.73 and $35.46
- Watch RSI for confirmation; above 55 or below 45 could validate direction
- Volume spike on breakout is essential
For those waiting on the sidelines, this is a textbook squeeze – tension is building and the breakout could be quick. Use tight stops and manage your exposure; silver’s next move won’t wait long.
- Check out our free forex signals
- Follow the top economic events on FX Leaders economic calendar
- Trade better, discover more Forex Trading Strategies
- Open a FREE Trading Account
- Read our latest reviews on: Avatrade, Exness, HFM and XM
Related Articles


Sidebar rates
Related Posts
