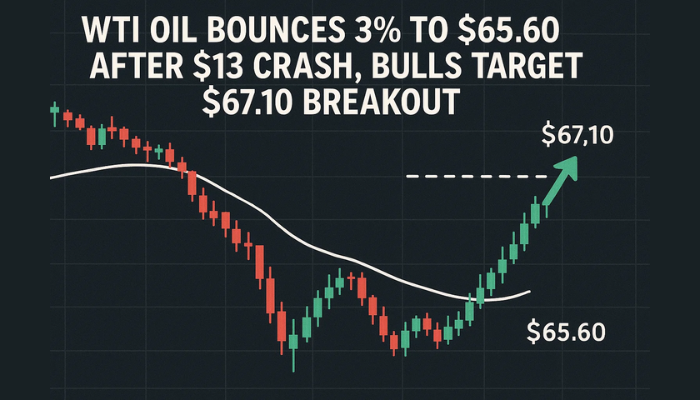
WTI Oil Bounces 3% to $65.60 After $13 Crash, Bulls Target $67.10 Breakout
WTI crude oil futures edged higher to $65.60 on Friday, recovering from a steep $13 plunge earlier in the week.
Quick overview
- WTI crude oil futures rose to $65.60 after a significant drop earlier in the week, driven by geopolitical tensions and subsequent easing of fears.
- Despite the recent recovery, the overall weekly trend for oil prices remains negative, potentially marking the worst decline since March 2023.
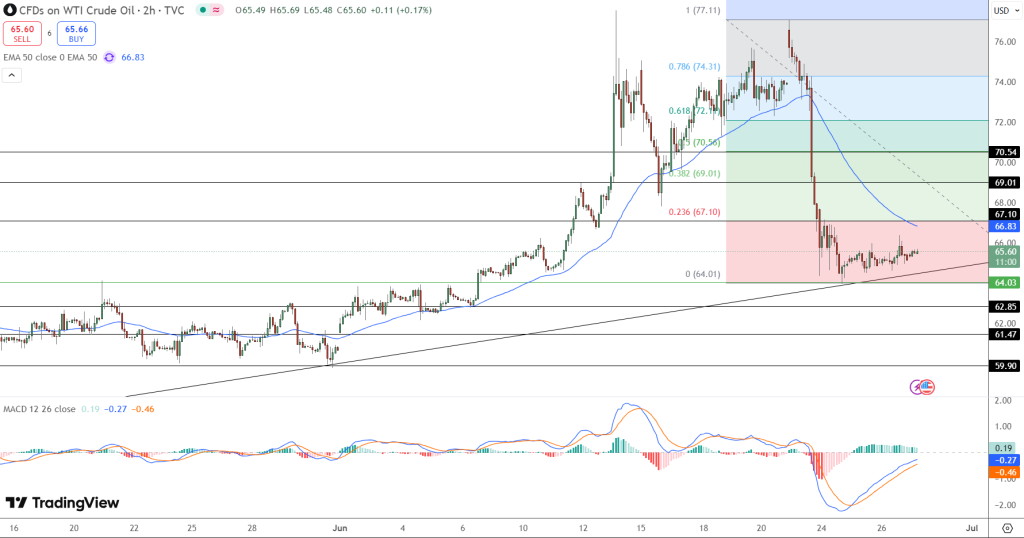
- Technical indicators suggest a potential bullish reversal, with key resistance levels at $67.10 and $66.83, while support is noted at $64.03.
- Market participants are closely monitoring the upcoming OPEC meeting and U.S.-China trade talks for signals that could influence supply and demand dynamics.
WTI crude oil futures edged higher to $65.60 on Friday, recovering from a steep $13 plunge earlier in the week. Prices surged as high as $77.11 on Monday after U.S. airstrikes on Iranian nuclear facilities, only to reverse sharply following President Trump’s ceasefire announcement. The truce helped ease fears of a wider Middle East conflict that could threaten global supply.
Yet the broader weekly trend remains negative. If losses hold, it would mark oil’s worst weekly decline since March 2023. Trump’s comments continue to create uncertainty—he acknowledged that sanctions haven’t curbed China’s imports of Iranian oil, leaving markets guessing about the next steps in U.S. energy policy.
Fueling some optimism, U.S. summer driving season demand is kicking in. Domestic crude inventories have dropped to an 11-year seasonal low, supporting prices even as geopolitical risk cools. A weaker U.S. dollar is also helping, making oil cheaper for international buyers.
Bulls Hold $65.60 as Triangle Forms
Technically, WTI crude is trying to carve out a base. After bottoming at $64.01, the price is consolidating in a tightening range—forming what looks like an ascending triangle just below the 23.6% Fibonacci retracement level at $67.10.
Momentum is showing signs of life. The MACD has flipped bullish, and the histogram is turning green. Still, bulls face a tough test at the 50-period EMA, currently near $66.83.
Key levels to watch:
- Resistance: $67.10, $69.01, $70.56
- Support: $64.03, $62.85, $61.47
- EMA resistance: 50-period at $66.83
A breakout above $67.10 would likely spark a move toward $69 and $70.50. Failure to clear this zone could send prices back toward the $64 support range.
OPEC Meeting, China Trade Talks Ahead
Looking ahead, now all eyes are on the July 6 OPEC meeting and developments in U.S.-China trade negotiations. Any hints of limited supply or increase in demand has a potential to strengthen bullish conviction. Yet, the backdrop remains fragile.
While the recent rebound is encouraging, traders remain cautious. The market wants confirmation—a clean break above resistance and signs that demand fundamentals can offset the fading geopolitical premium.
Until then, oil remains in recovery mode, but the path higher isn’t yet secure.
- Check out our free forex signals
- Follow the top economic events on FX Leaders economic calendar
- Trade better, discover more Forex Trading Strategies
- Open a FREE Trading Account
- Read our latest reviews on: Avatrade, Exness, HFM and XM
Related Articles


Sidebar rates
Related Posts
