Silver Forecast: $38 Target in Sight as Industrial Demand and Breakout Setup Align
Silver (XAG/USD) continues to trade firm near $36.16, extending its 24% year-to-date rally. Behind the move is a clear imbalance...

Quick overview
- Silver (XAG/USD) is trading near $36.16, continuing its 24% year-to-date rally due to growing industrial demand and supply constraints.
- The global silver market is projected to face a 117 million ounce deficit in 2025, driven largely by demand from solar panels and electric vehicles.
- Investor sentiment is bullish, with forecasts predicting silver could reach $38–$40 by year-end, supported by its dual role as an industrial metal and inflation hedge.
- A technical breakout pattern is forming, with key resistance at $36.83 and support at $35.29, indicating potential for significant price movement.
Silver (XAG/USD) continues to trade firm near $36.16, extending its 24% year-to-date rally. Behind the move is a clear imbalance: growing industrial demand and persistent supply constraints.
According to the Silver Institute, the global silver market is projected to face a 117 million ounce deficit in 2025, its fifth consecutive year in the red.
Nearly 80% of silver’s demand is tied to solar panels, electric vehicles, and consumer electronics, positioning it as a core component in the green energy revolution. And while global mine supply has shown slight growth of 2%–3%, it’s not keeping pace.
Low ore grades and rising production costs continue to cap output, reinforcing the bullish long-term structure.
In my experience, when strong fundamentals like these align with technical setups, it’s usually worth paying attention.
Bulls Set Sights on $38 as July Momentum Builds
Investor sentiment is heating up. Institutions like Citi, JP Morgan, and Saxo Bank now forecast silver climbing to the $38–$40 range by year-end. Robert Kiyosaki has also doubled down on silver, calling it the “best asymmetric buy” and projecting $37 in the short term and beyond $50 by 2026.
Silver’s dual identity—as both an industrial metal and inflation hedge—has only grown stronger in recent months. With global inflation still sticky and geopolitical risks simmering, silver continues to attract both tactical traders and long-term allocators.
The falling gold-silver ratio—from 105 to around 94—reflects this shift in sentiment, signaling silver’s growing relative strength compared to gold.
Silver Technical Picture: Breakout Pattern Nearing Completion
On the 4-hour chart, silver is coiling into a symmetrical triangle—an often-reliable setup for breakout trades. Price is currently pinned between horizontal resistance at $36.83 and rising trendline support from $35.29, forming a tight technical structure.
Levels to Watch:
- Resistance: $36.72 → $36.83 → $37.29
- Support: $35.29 → $34.76 → $34.16
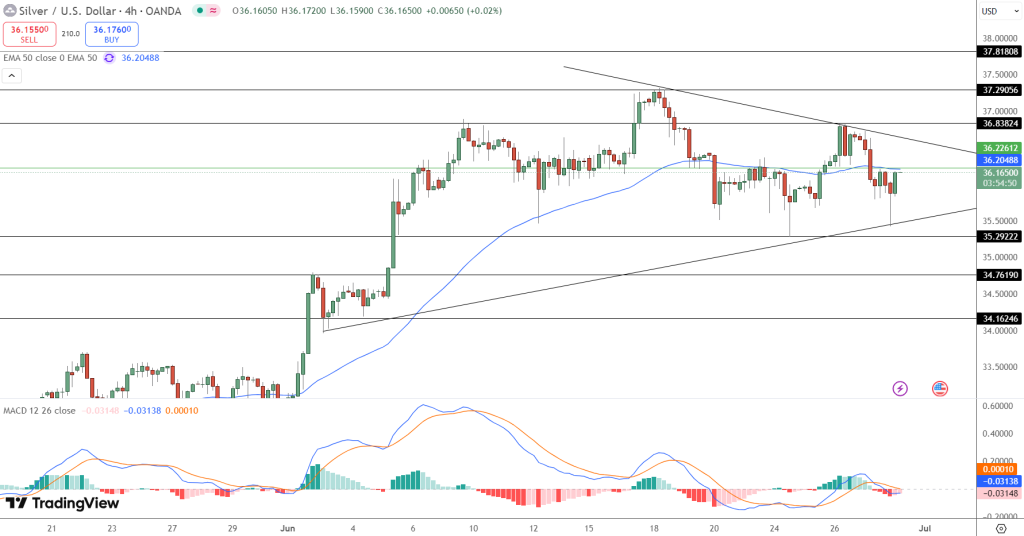
The 50-period EMA at $36.20 is acting as short-term resistance. Meanwhile, MACD signal lines are converging and the histogram is flat near zero—usually a sign that volatility is about to expand.
A breakout above $36.83 with strong volume could open the door toward $37.81 and $38.00. But if silver loses $35.29 support, that would invalidate the triangle and suggest a deeper correction is likely.
Conclusion: Silver’s Breakout in the Making?
With increasing industrial demand, supply constraints, and a textbook breakout setup forming, the XAU/USD looks ready to take decisive price action. Whether you’re trading short-term patterns or holding long based on fundamentals, this is one of those moments worth monitoring closely.
If bulls follow-through above resistance, $38 could be just the beginning. Until then, silver remains a high-conviction watchlist asset for July.
- Check out our free forex signals
- Follow the top economic events on FX Leaders economic calendar
- Trade better, discover more Forex Trading Strategies
- Open a FREE Trading Account
- Read our latest reviews on: Avatrade, Exness, HFM and XM