Gold Price Eyes $3,375 Breakout as Trade Tensions and CPI Fuel Momentum
Gold prices hovered around $3,358 per ounce on Monday after briefly hitting a three-week high. The pullback comes amid investor...
Quick overview
- Gold prices are currently around $3,358 per ounce, following a brief rise to a three-week high.
- Investor caution is heightened due to upcoming U.S. inflation data and new tariffs announced by President Trump.
- Technical analysis shows gold is consolidating within a symmetrical triangle pattern, indicating potential for a breakout.
- The overall sentiment towards gold remains positive, with key resistance at $3,375 and support at $3,340.
Gold prices hovered around $3,358 per ounce on Monday after briefly hitting a three-week high. The pullback comes amid investor caution ahead of U.S. inflation data and escalating global trade tensions.
U.S. President Donald Trump’s latest move—announcing a 30% tariff on most EU and Mexican imports starting next month—sparked fresh volatility in metals markets. Trade partners, including South Korea and Japan, are reportedly negotiating exemptions. Meanwhile, the U.S. dollar climbed to its highest in nearly three weeks, pressuring dollar-denominated gold for non-U.S. buyers.
Bart Melek, head of commodity strategy at TD Securities, said the dip is mostly technical. “We’re seeing some profit-taking after the recent rally, but overall sentiment toward gold remains positive,” he noted. With Trump urging the Fed to lower interest rates, the macro environment continues to favor non-yielding assets like gold.
Investors now await Tuesday’s Consumer Price Index (CPI) and Wednesday’s Producer Price Index (PPI) reports, both critical for gauging the Fed’s next rate move. Any signs of sticky inflation could delay rate cuts, capping gold’s upside.
Technical Picture: Triangle Builds Pressure
On the 4-hour chart, gold is consolidating within a symmetrical triangle pattern. The price action suggests a buildup of momentum, but traders are still waiting for a decisive breakout.
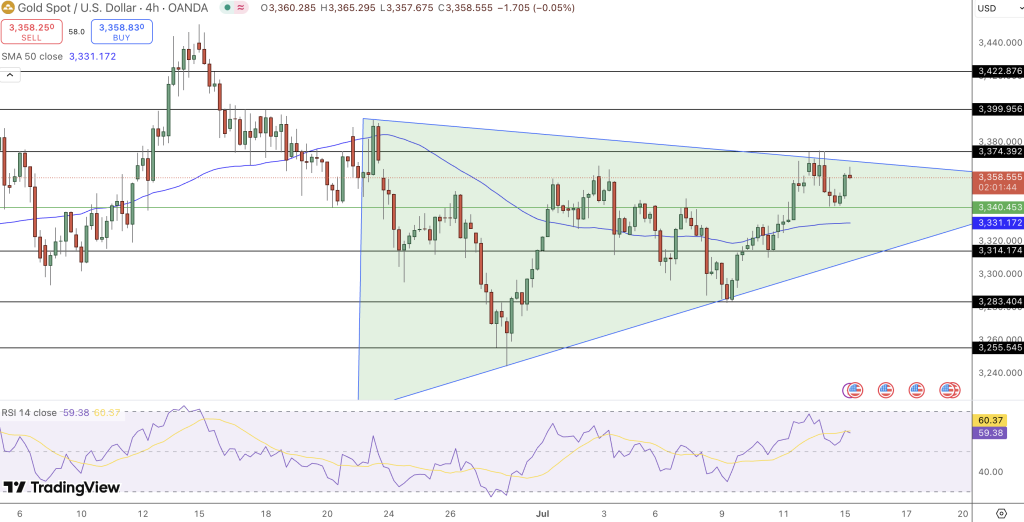
- Resistance to Watch: The triangle’s upper boundary at $3,375 is the key breakout level. A close above this may open the door to $3,399 and $3,422 targets.
- Support Levels: Immediate support sits at $3,340, followed by the 50-period SMA at $3,331. A breach of this zone could trigger a deeper move toward $3,314 or even $3,283.
- Momentum Signals: RSI is currently near 59.38, below the overbought threshold, indicating buyers are still active but not overheated.
This triangle formation shows gold in a classic “coiling” phase—where range tightens before a breakout, typically aligning with major economic catalysts like CPI.
Gold Weekly Outlook
The technical and fundamental setup leans neutral to bullish. If gold breaks above $3,375 with volume, expect renewed upside toward $3,422. A drop below $3,331 could invite short-term bearish pressure, especially if CPI surprises to the upside.
- Check out our free forex signals
- Follow the top economic events on FX Leaders economic calendar
- Trade better, discover more Forex Trading Strategies
- Open a FREE Trading Account
- Read our latest reviews on: Avatrade, Exness, HFM and XM
Related Articles


Sidebar rates
Related Posts
