Bitcoin Consolidates Above $115K: MicroStrategy Expands Offering, Technical Warning Signs Flashing
Bitcoin (BTC) is still trading above the important $115,000 milestone, even if it has dropped 2.8% in the last 24 hours. Recent market data
Quick overview
- Bitcoin is currently trading above $115,000 but has seen a 2.8% drop in the last 24 hours, with prices around $117,449.
- MicroStrategy's increased stock offering to $2 billion reflects growing institutional confidence in Bitcoin, as the company holds 607,770 BTC.
- Technical indicators suggest potential short-term weakness for Bitcoin, with a hidden bearish divergence and an unfilled CME gap indicating possible price corrections.
- Despite near-term risks, the overall bullish structure remains intact, with a target of $135,000 if Bitcoin surpasses the $120,000 resistance zone.
Bitcoin BTC/USD is still trading above the important $115,000 milestone, even if it has dropped 2.8% in the last 24 hours. Recent market data shows that prices are now around $117,449. The largest cryptocurrency in the world is at a crucial point right now. Demand from institutions is rising quickly, but technical indications are sending out warning signals about possible short-term weakness.
MicroStrategy’s $2 Billion Bitcoin Acquisition Strategy Signals Institutional Confidence
Michael Saylor’s MicroStrategy has greatly increased its preferred stock offering from $500 million to $2 billion. This shows that institutions still have faith in Bitcoin’s long-term future. The business intelligence company has turned into a Bitcoin treasury company and now owns 607,770 BTC that it has built up since adopting its Bitcoin strategy in 2020.
Major banks like Morgan Stanley, Barclays, TD Securities, and Moelis & Co. are backing the Series A Perpetual Preferred shares, which cost $90 each. They have a 9% yield at first. MicroStrategy’s stock (MSTR) has gone up 37% so far this year and an incredible 146% over the past 12 months. This is much better than the S&P 500’s 17% rise.
The corporation is still the biggest holder of Bitcoin among public companies, with 66% of all public company Bitcoin holdings. BitcoinTreasuries.NET says that the top 100 publicly traded businesses own a total of 917,599 BTC. MicroStrategy’s huge position dwarfs that of MARA Holdings, which has only 50,000 BTC.
BTC/USD Technical Analysis: Mixed Signals Amid Consolidation Pattern
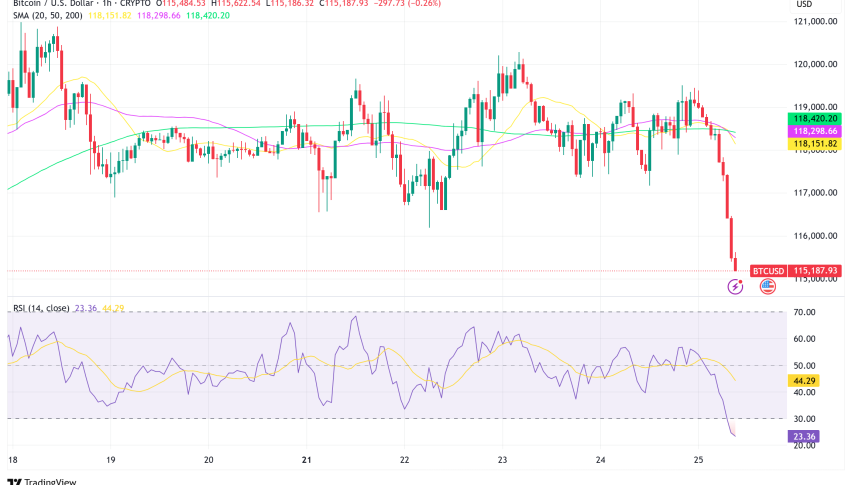
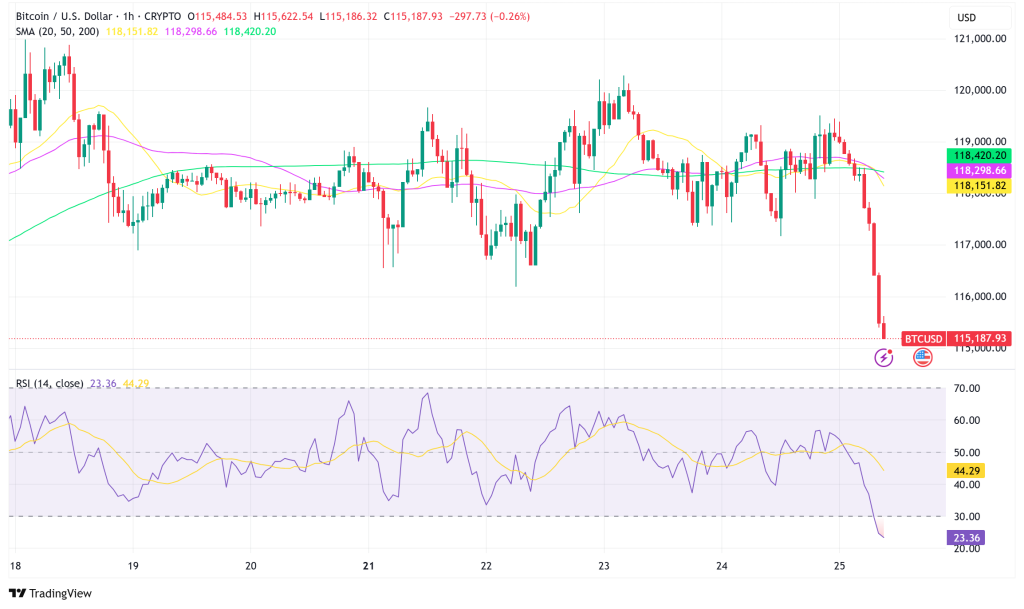
Even though institutions are hopeful, Bitcoin’s technical picture shows a more complicated picture. The cryptocurrency is stuck between the 20-day simple moving average at $115,961 and resistance above $120,000. This is forming a narrowing consolidation pattern that technical analysts think might end with a big move in one direction or the other.
The 20-day SMA and the relative strength index (RSI) are both moving higher, which means that bullish momentum is still going strong. But there are a lot of technical warning flags that could mean a short-term drop before the next big rally phase.
Hidden Bearish Divergence Mirrors March 2024 Pattern
A concealed negative divergence between Bitcoin’s price and the RSI momentum indicator is a worrying sign. This pattern, where the price makes higher highs and the RSI makes equal or lower highs, happened in March 2024 and came before a 20% drop in price.
The pattern shows that the present rise is losing steam, which might lead to a correction that pushes Bitcoin down to new short-term lows in the $110,530-$115,000 support zone.
CME Gap Creates Downside Magnet
There is an unfilled CME gap on the daily chart between $114,380 and $115,635, which adds to the chances of going down. Bitcoin has a history of “filling” these gaps, and by 2025, seven out of nine CME holes have already been filled. Because the fill rate is so high, there is a better chance of a short-term drop to fill this price gap.
Distribution Zone Warning
The Index Bitcoin Cycle Indicators (IBCI) has entered the distribution zone for the third time in the current bull cycle. This is a time when the market is usually quite happy and there are temporary tops. The indicator barely reached 80% of the zone instead of the 100% level that marks the conclusion of the cycle. This is a warning sign of possible short-term corrective danger.
Bitcoin Price Prediction: $135K Target Remains Intact Despite Near-Term Risks
The overall bullish structure is still in place, even though there are caution signs. If buyers can get Bitcoin above the $120,000-$123,218 resistance zone, the cryptocurrency might start to rise again toward its first goals of $135,729 and then $150,000.
Key support levels to monitor include:
- Immediate support: $115,000 (current defense level)
- Secondary support: $110,530 (neckline of inverse head-and-shoulders pattern)
- Critical support: If it breaks below $110,530, bears will have the upper hand.
On the plus side, a clear break over $123,218 would mean that the bull trend is still going strong. This might lead to the next impulse move toward $135,000, as technical analysis suggests.
Institutional vs. Retail Dynamic Shapes Market Structure
As institutional investors lead the current cycle and retail interest stays low, the market is clearly changing. Burak Kesmeci, an analyst at CryptoQuant, says that retail investors have been less interested in Bitcoin since early 2023. On the other hand, institutional investors and institutions have been steadily increasing their holdings, especially since early 2024.
This story is backed up by Google Trends data, which shows that people are still not as interested in Bitcoin as they were during past bull runs. The lack of excitement from retailers is very different from the huge interest from the public during Bitcoin’s rise in 2021. This suggests that the current phase is more about institutional accumulation than speculative hysteria.
Kesmeci said, “The crowd hasn’t woken up yet,” and “smart money is on stage right now, and most people are still watching from the sidelines.” This dynamic has historically shown that there is still a lot of upside potential until retail engagement finally happens.
- Check out our free forex signals
- Follow the top economic events on FX Leaders economic calendar
- Trade better, discover more Forex Trading Strategies
- Open a FREE Trading Account
- Read our latest reviews on: Avatrade, Exness, HFM and XM
Related Articles


Sidebar rates
Related Posts
