Solana Price Tests Critical $178 Support as 2027 Roadmap Sparks Long-Term Optimism
Solana (SOL) is now worth $178, down 2.5% in the last 24 hours. The cryptocurrency is testing a key support level after a big drop from
Quick overview
- Solana (SOL) is currently priced at $178, experiencing a 2.5% decline in the last 24 hours after dropping from recent highs above $200.
- Over $57 million in leveraged positions were liquidated recently, indicating bearish pressure in the market despite some technical indicators suggesting a potential reversal.
- On-chain data shows a negative trend with sellers dominating, as 86.79% of liquidated positions were long, reflecting overly bullish sentiment among traders.
- The short-term outlook for SOL hinges on maintaining support levels around $178-$182, with potential for a bounce if these levels hold.
Solana SOL/USD is now worth $178, down 2.5% in the last 24 hours. The cryptocurrency is testing a key support level after a big drop from recent highs above $200. The drop has caused a lot of trouble in the market, with CoinGlass statistics showing that more than $57 million in leveraged positions were closed in the last day. Even while there is bearish pressure in the short term, technical indicators and Solana’s revised 2027 strategy are sending conflicting signals to traders and long-term investors.
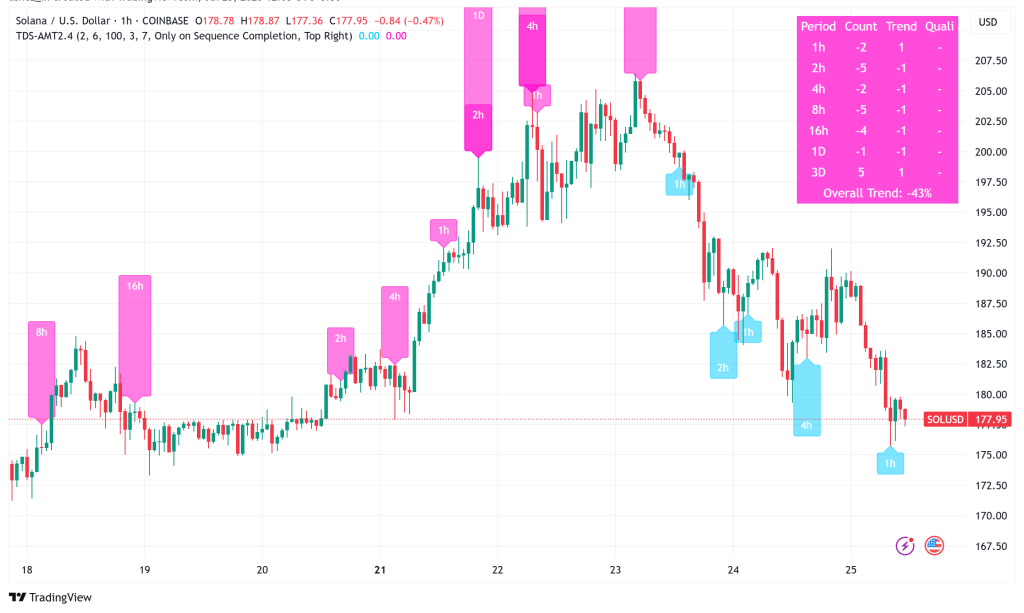
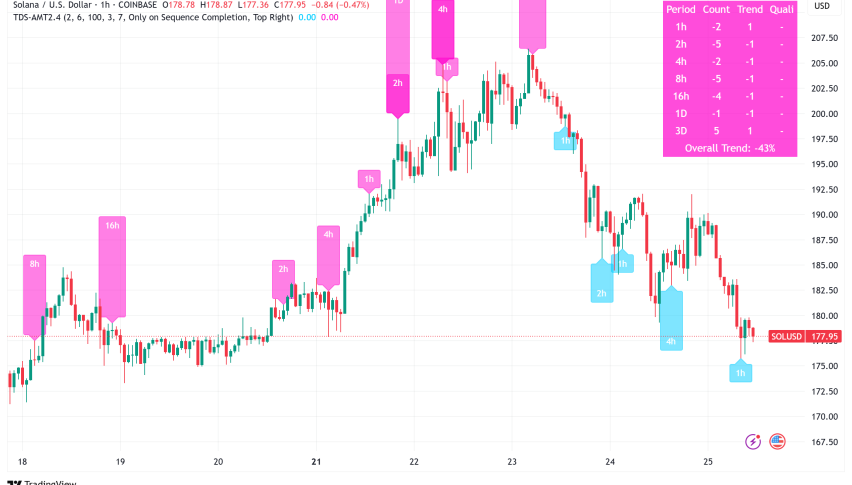
SOL/USD Technical Analysis: Mixed Signals at Key Support
The price movement around $178 right now is quite important for SOL. The cryptocurrency reached a high of $205.34 earlier this week, but it has dropped about 12% in only two days, breaking below the daily support level of $184.13 on Thursday.
But technical analysts are seeing signs that the trend might change. The “9” buy signal on the 4-hour chart’s TD Sequential indicator suggests that selling pressure may be running out. This popular technical technique is meant to find possible reversal points after certain trend sequences. Right now, its reading matches SOL probing the $182.5-$185 demand zone.
Recent price movements show that buyers are interested at these levels. For example, lengthy lower wicks on candles show that people are buying defensively around $182. Two little white-bodied candles about $187 have also shown up, which could mean that the trend is starting to change.
The Relative Strength Index (RSI) on the daily chart is at 56, down drastically from levels that were too high. The MACD indicator shows signals coming together and green histogram bars getting shorter, both of which imply that bullish momentum is weakening but not yet oversold.
Solana’s On-Chain Data Reveals Bearish Undertone
On-chain measures, on the other hand, provide a more cautious picture, even though there are signs of a technical reversal. CryptoQuant data shows that SOL’s Spot Taker CVD (Cumulative Volume Delta) has turned negative and is still going down. This means that the market is dominated by sellers. Over a three-month period, this statistic shows the cumulative difference between the volumes of market buys and sells. If the numbers are negative and getting smaller, it means that bears are in charge of momentum.
The liquidation data backs up this pessimistic story even further. 86.79% of the $57 million in liquidated positions in the last 24 hours were long positions. This shows that people were too bullish and had to unwind their positions. This comes after an even bigger wave of liquidations that totaled $101.38 million from Wednesday to early Friday.
Adding to the bad mood, Burwick Law, a law company, filed a class-action lawsuit against Pump.Fun, the inventor of the Solana-based memecoin, as well as Solana Labs and the Solana Foundation, claiming that they broke RICO statutes by running an illegal gambling enterprise.
Solana Price Predictions: Critical Levels Ahead
The short-term price prognosis for SOL depends on whether or not it can stay above its present support levels. If there isn’t enough buying activity in the $178-$182 range, technical analysts think the price might drop to the next key support level around $160, which would be a 10% drop from where it is now.
On the other hand, a successful defense of current levels could cause a short-term bounce. Technical analysts say that a move above $190 would make the bullish reversal scenario more believable and might aim for the $194-$200 range. If the price goes up more than the broken $184.13 level, it might go up to the recent high of $205.34.
As SOL continues to trade in line with other digital currencies, volume confirmation and the overall mood of the cryptocurrency market are expected to be the main factors that affect its short-term trajectory.
- Check out our free forex signals
- Follow the top economic events on FX Leaders economic calendar
- Trade better, discover more Forex Trading Strategies
- Open a FREE Trading Account
- Read our latest reviews on: Avatrade, Exness, HFM and XM
Related Articles
Sidebar rates
Related Posts
