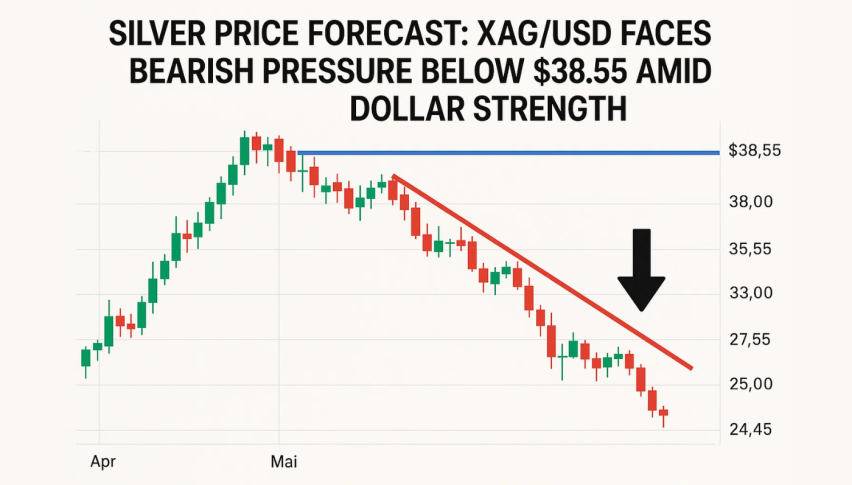
Silver Price Forecast: XAG/USD Faces Bearish Pressure Below $38.55 Amid Dollar Strength
Silver (XAG/USD) is struggling to hold ground, currently trading at $38.18 after a sharp drop from last week’s high of $39.51.
Quick overview
- Silver (XAG/USD) is currently trading at $38.18 after a significant drop from last week's high of $39.51.
- The price has broken below the ascending trendline and the 50-period Simple Moving Average, indicating a potential short-term trend reversal.
- Weakness in the precious metals market is attributed to a strengthening US dollar and high interest rates reducing the appeal of non-yielding assets like silver.
- Immediate support for silver is at $37.96, with resistance levels at $38.55 and $38.75, while bullish momentum requires a close above $38.75.
Silver (XAG/USD) is struggling to hold ground, currently trading at $38.18 after a sharp drop from last week’s high of $39.51. It has broken below both the ascending trendline and the 50-period Simple Moving Average (SMA) which was previously supporting at $38.55. This double break is a short term trend reversal signal and bearish momentum may continue to build.
The breakdown aligns with weakness across the precious metals complex as safe-haven demand eases and US dollar strengthens. Silver failed to bounce meaningfully from $38.00 – a psychological level – and with RSI at 35.36 just above oversold, sellers are in control.
US Dollar and Macro Cues Add Pressure
Most of silver’s recent decline can be attributed to macro themes. US Dollar Index (DXY) is strong ahead of the Federal Reserve meeting. Market expects Fed to keep rates unchanged at 4.50% but the tone of Chair Jerome Powell’s comments will be closely watched for hints of rate cuts in late 2025.
High interest rates reduce the appeal of silver and gold as they offer no yield. With recent US data – jobless claims and consumer confidence – showing economic strength, the dollar is getting bids. For silver, this means more downside as global investors rotate into yield bearing assets.
Silver Technical Outlook: Key Levels and Momentum
From a technical perspective, silver’s breakdown below $38.55 puts immediate support at $37.96 in focus. A close below this could expose $37.37 and $36.86 – both were consolidation zones during the early July rally. On the upside, the broken 50-SMA and former trendline is resistance. Bulls need a daily close above $38.75 to neutralize the trend.
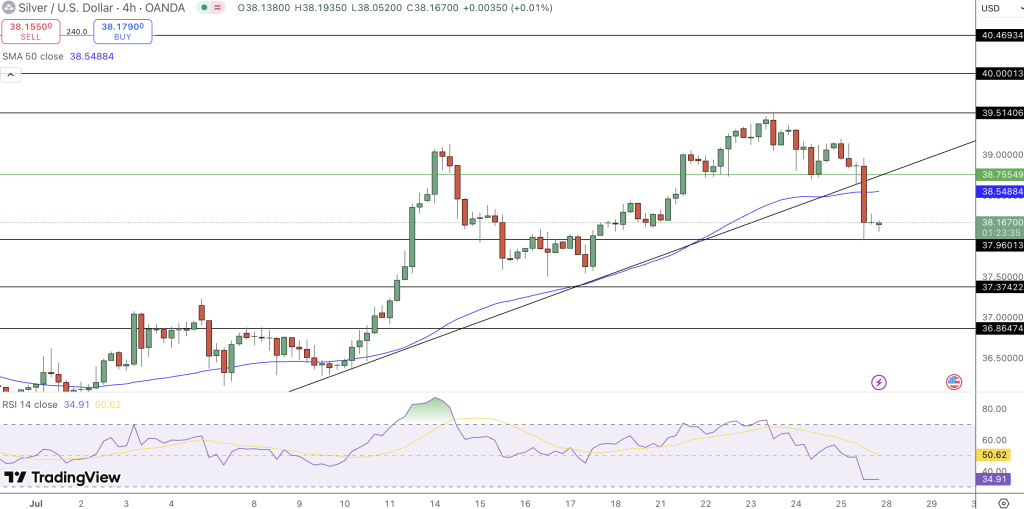
Momentum indicators support the bearish view. RSI is declining but not yet oversold, there’s room for more downside. Volume during the breakdown was high, confirming the move.
Summary:
- Price below 50-SMA and trendline* RSI 35.36
- Resistance: $38.55, $38.75, $39.51
- Support: $37.96, $37.37, $36.86
Bullish only above $38.75. Waiting for US GDP and employment data this week.
- Check out our free forex signals
- Follow the top economic events on FX Leaders economic calendar
- Trade better, discover more Forex Trading Strategies
- Open a FREE Trading Account
- Read our latest reviews on: Avatrade, Exness, HFM and XM
Related Articles


Sidebar rates
Related Posts
