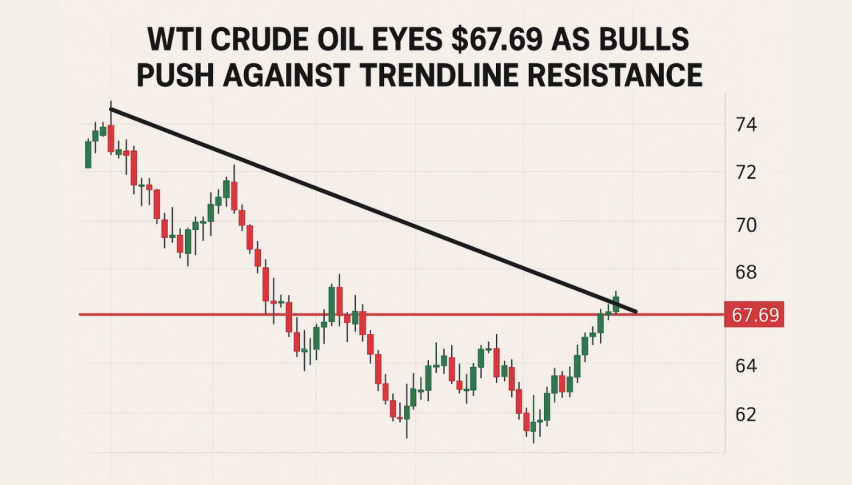
WTI Crude Oil Eyes $67.69 as Bulls Push Against Trendline Resistance
WTI Crude Oil (USOIL) is looking to continue higher after bouncing off the $66.50 support which is now the rising trendline from July 23.
Quick overview
- WTI Crude Oil is showing bullish momentum after bouncing off the $66.50 support level, which is a respected rising trendline.
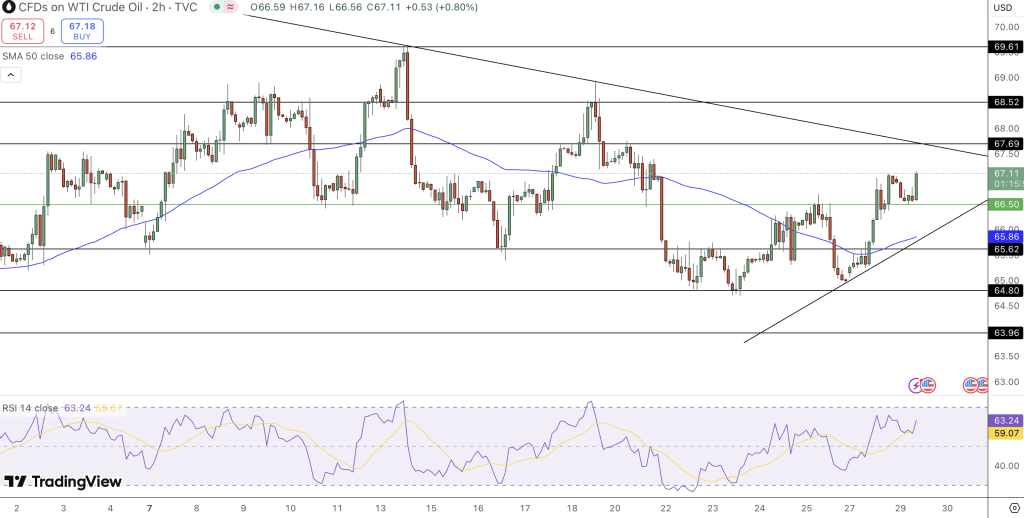
- Current price is $67.08, approaching resistance at $67.69, with potential targets of $68.52 and $69.61 if this level is broken.
- The 50 SMA is supporting the price at $65.86, indicating short-term bullish strength, while the RSI is in bullish territory at 62.91.
- Key levels to watch include immediate resistance at $67.69 and support at $66.50, with dips considered buying opportunities as long as the trendline holds.
WTI Crude Oil (USOIL) is looking to continue higher after bouncing off the $66.50 support which is now the rising trendline from July 23. This trendline has been respected multiple times, so short term is bullish.
Price is currently at $67.08, up +0.75% on the day and approaching the resistance zone of $67.69. This level coincides with the downward sloping trendline from mid July. A break above this zone could lead to $68.52 and $69.61.
SMA and RSI Confirm Bullish
50 SMA has turned up and is now supporting price at $65.86, so short term is bullish. Price above this support is trend strength especially with WTI printing higher lows.
On the momentum side, RSI 14 is at 62.91, in bullish territory but not overbought. RSI has crossed above its signal line (59.05) and has been making higher highs.
WTI Crude Oil: Key Levels to Watch
- Immediate Resistance: $67.69, $68.52 and $69.61
- Support: $66.50, $65.62 (SMA) and $64.80
- Breakout Confirmation: Close above $67.69 with volume
- Bullish RSI Trigger: Sustained RSI above 60 with price higher
WTI Crude Oil Outlook: Breakout or Pullback
If bulls can break above $67.69 cleanly, next target is $68.52, a previous supply zone. Momentum indicators have room to go higher but be cautious of rejection at trendline resistance.
If fails to hold above $66.50, could retest $65.62-$64.80. As long as the trendline holds, dips are buy opportunities.
- Check out our free forex signals
- Follow the top economic events on FX Leaders economic calendar
- Trade better, discover more Forex Trading Strategies
- Open a FREE Trading Account
- Read our latest reviews on: Avatrade, Exness, HFM and XM