Bitcoin Price Prediction: Tech Setup Points to $155K for BTC Price as May ATH Holds
As institutional demand is still strong and technical support persists, Bitcoin is regaining ground, indicating a run to $155,000.

Quick overview
- Bitcoin is regaining momentum, with strong technical support and institutional demand suggesting a potential rise to $155,000.
- The recent pullback appears to have ended, with the previous high of $111,000 acting as a solid support level.
- Technical indicators show bullish strength, with the stochastic indicator hinting at an upward move as Bitcoin holds firm above key moving averages.
- Macro factors, including an expanding M2 money supply and a weakening U.S. Dollar, are contributing to Bitcoin's resilience and potential for future gains.
Live BTC/USD Chart

As institutional demand is still strong and technical support persists, Bitcoin is regaining ground, indicating a run to $155,000.
Recovery After a Short-Lived Correction
Bitcoin’s recent pullback, which followed two consecutive doji candlesticks hinting at a potential bearish reversal, appears to have run its course. The previous high near $111,000 has now acted as a strong support level, prompting a rebound yesterday. After a volatile start to 2025, the digital asset has reasserted its dominance, breaking back above the $120,000 mark despite ongoing macroeconomic turbulence.
BTC/USD Chart Weekly – Will the Retreat Continue or Stall Here

Technical Strength Supports the Uptrend
The broader technical picture remains bullish. Earlier this year, Bitcoin dipped below $100,000 but quickly found long-term support at the 50-week simple moving average around $75,000. This level set the stage for a powerful July rally to fresh cycle highs of $123,000. While hawkish FOMC commentary triggered two weeks of consolidation just below resistance, the subsequent decline proved temporary.
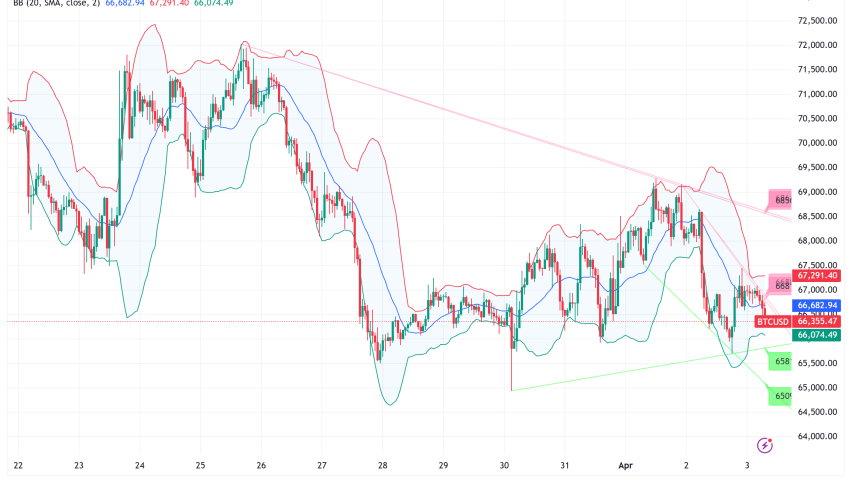
On August 1, on-chain data from CryptoQuant showed over 40,000 BTC moved to exchanges at a loss by short-term holders, signaling capitulation. Yet, the price held firm at the 50-day SMA (yellow), coinciding with the prior all-time high from May.
BTC/USD Chart Daily – The 50 SMA Held As Support

The stochastic indicator is now exiting oversold territory, hinting at an upward move next. The last two bullish moves witth BTC printing two record highs were worth $45K, so if this turned out to be similar, then the next bullish phase could target $155,000 if momentum continues to build.
Macro Tailwinds Remain in Play
Bitcoin’s resilience is also supported by a global backdrop of expanding M2 money supply and a weakening U.S. Dollar Index (DXY). Historically, both factors have served as powerful catalysts for crypto market rallies, reinforcing the argument for a potential breakout to new highs in the weeks ahead.
Bitcoin Live Chart
- Check out our free forex signals
- Follow the top economic events on FX Leaders economic calendar
- Trade better, discover more Forex Trading Strategies
- Open a FREE Trading Account
- Read our latest reviews on: Avatrade, Exness, HFM and XM
Related Articles

Sidebar rates
Related Posts
