Bitcoin Consolidates Above $114K, Bulls Target Critical $116K Liquidity Zone
Bitcoin's strength keeps showing as the world's biggest cryptocurrency stays above the important $114,000 support level. This sets the way

Quick overview
- Bitcoin remains above the crucial $114,000 support level, indicating potential for a move towards $116,000.
- Whale activity on Binance suggests strong market confidence despite a recent 4% price drop.
- Long-term holders maintain a bullish outlook with a Net Unrealized Profit/Loss ratio above 0.5, contrasting with short-term traders taking profits.
- Technical analysis indicates that a breakout above $116,800 could lead to further price increases, while failure to surpass $115,500 may result in a decline.
Bitcoin’s BTC/USD strength keeps showing as the world’s biggest cryptocurrency stays above the important $114,000 support level. This sets the way for a possible breakthrough toward $116,000 in the next few sessions.
BTC Whale Activity Signals Market Confidence Despite Short-Term Volatility
Recent on-chain analysis has given us some interesting information about how big investors operate, and Binance is the most popular platform for whale transactions over 1,000 BTC. Data shows that Binance has had more than 56 million whale-level deals, which is a lot more than its competitors. This shows that the exchange has better liquidity for institutional players.
This high level of trading activity implies that smart investors are still interested, even though the price has dropped 4% in the last week. The way whales are acting shows that big holders are very sure of their positions and are looking to make money over the long run instead of giving up during short-term dips.
Long-Term Holders Maintain Bullish Conviction
The fact that long-term holders (LTH) have a Net Unrealized Profit/Loss (NUPL) ratio above 0.5 is probably the most positive sign for Bitcoin’s medium-term future. This number shows that experienced Bitcoin investors have a lot of unrealized gains but aren’t giving them away to a lot of people.
There is a big difference between how long-term and short-term holders act. Short-term traders seem to be taking profits amid rallies, which puts temporary selling pressure on the market. On the other hand, the hodler base is very stable. In the past, this dynamic has created a base of support that has come before big upward surges.
Bitcoin ETF Flows and Institutional Sentiment in Focus
The $812 million outflow from US spot Bitcoin ETFs on Friday was the second-largest single-day evacuation on record. This made many worry about how much institutions wanted to buy. But analysts say that Monday’s ETF flows will be very important for figuring out if this is just a short-term profit-taking move or a more worrying change in institutional attitude.
QCP Capital is cautiously bullish because Bitcoin’s monthly closing in July was the highest ever, and the current drop seems “more corrective than capitulatory.” The trading company says that shakeouts after a rise, especially those that flush out too much leverage, have traditionally generated chances for new accumulation.
BTC/USD Technical Analysis Points to Key Resistance at $116K
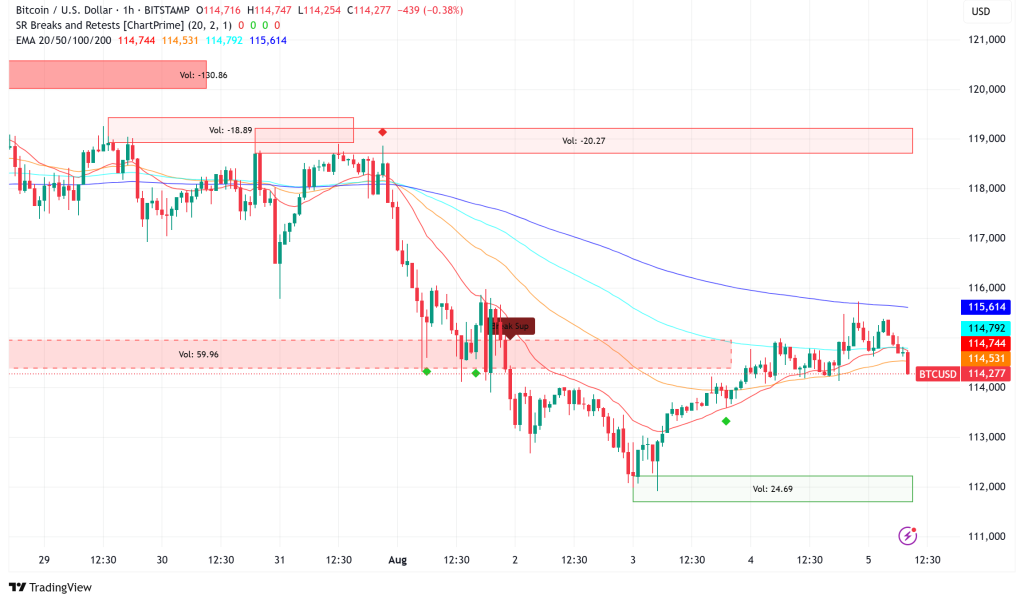
After a weekend drop that saw Bitcoin briefly approach $112,296, the digital asset has slowly started to rebound and is now trading at $114,314 on major exchanges. The recent price movements have set up a very interesting technical situation. Data from the exchange order book shows that there are large concentrations of liquidity that could cause the next big move.
CoinGlass’s exchange data shows that Bitcoin has a big wall of sell orders at $115,800. The important $116,000 level is the top of the CME futures gap that was just filled. This gap closure usually acts as a strong price magnet, and traders are keeping a careful eye on Bitcoin’s ability to get back above this level.
The technical picture shows that buy orders are deliberately stacked from $113,800 to $112,000, with more support around the $110,000 level, which used to be Bitcoin’s all-time high and is now a strong support zone.
Bitcoin Price Prediction: $116K Break Could Trigger Rally to $121K
Technical indications point to a possible breakout for Bitcoin. The hourly MACD is gaining strength in positive zone, while the RSI is rising above the neutral 50 level. If it breaks through the $115,500 resistance level, it might quickly go toward the important $116,250 barrier.
If Bitcoin breaks through the important $116,800 resistance zone, technical analysis suggests objectives of $118,500, with further advances perhaps reaching $120,500 and the very high $121,200 mark. But if prices don’t get back above $115,500, they could drop back down to the $113,500 support level. If they break below that, they could go after the $110,500-$112,000 range.
- Check out our free forex signals
- Follow the top economic events on FX Leaders economic calendar
- Trade better, discover more Forex Trading Strategies
- Open a FREE Trading Account
- Read our latest reviews on: Avatrade, Exness, HFM and XM
Related Articles

Sidebar rates
Related Posts
