Bullish Outlook: Is Tesla Stock Set for Another Rally?

Quick overview
- Tesla's stock dropped over 56% between December and April but has since rebounded by approximately 67%.
- The stock found support at the 50-month EMA near $245 and must clear the $390 resistance to confirm a bullish trend.
- Recent technical indicators show mixed signals, with the MACD histogram trending lower while the MACD lines remain bullish.
- Immediate upside potential exists, with key resistance at $390 and support near $270, suggesting a possible 16.5% increase.
Tesla experienced a significant correction between December and April, dropping more than 56%. Since then, the stock has rebounded approximately 67%, raising the key question: Is there further upside potential for TSLA?
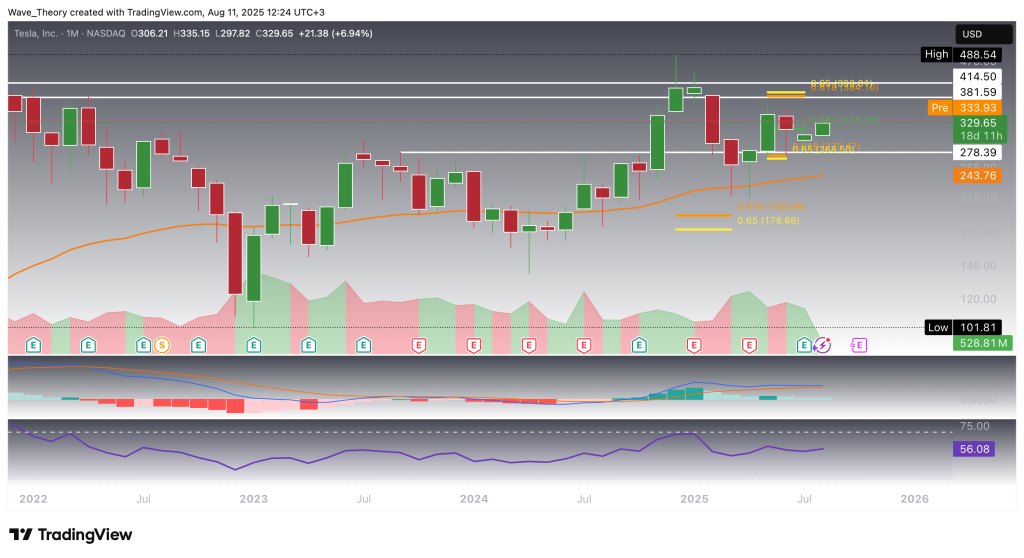
Tesla Stock Bounces Off 50-Month EMA Support, Eyes Key Resistance Ahead
Earlier this year, TSLA found critical support at the 50-month EMA near $245, sparking a strong upward move. However, for the corrective phase to be decisively over, Tesla must clear the golden ratio resistance at $390. A successful breakout above this level would open the path toward its all-time high at $488.50—and potentially beyond.
Momentum indicators present a mixed picture: the MACD histogram has been trending bearishly lower over the past three months, signaling caution, even as the MACD lines maintain a bullish crossover. Meanwhile, the RSI remains neutral, offering no clear directional bias at this stage.
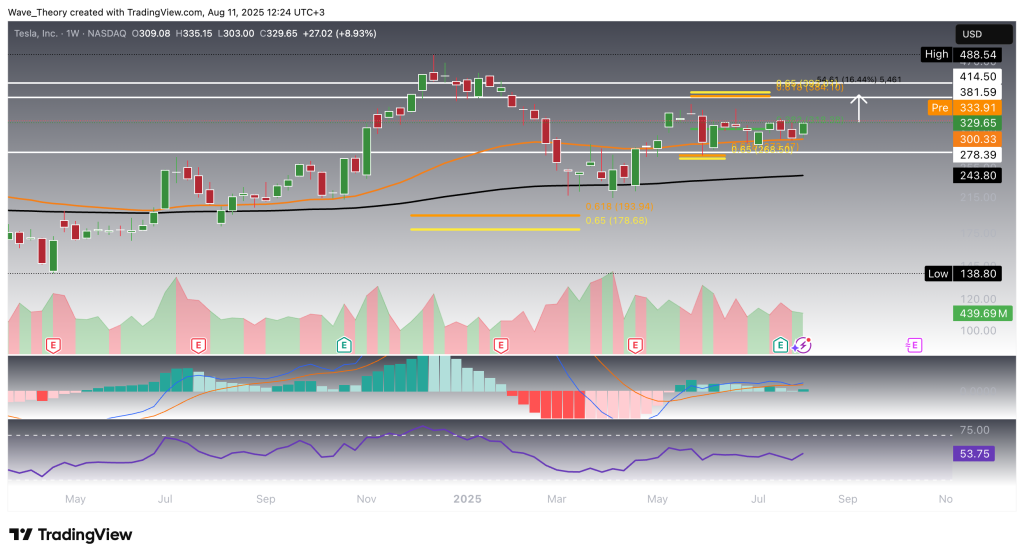
Tesla Stock Bounces Off 50-Week EMA Support, Eyes 16.5% Upside to Golden Ratio Resistance
While the key golden ratio resistance at $390 remains untested, Tesla recently retraced to the golden ratio support at $270, where it found bullish buying interest. Last week, TSLA successfully bounced off the 50-week EMA support near $300, reinforcing this level as a critical mid-term floor.
With momentum now shifting, Tesla appears poised to initiate an upward move toward the golden ratio resistance zone between $381.50 and $414.50, representing an upside potential of approximately 16.5%.
Technically, the MACD lines and EMAs are bullishly crossed, confirming a solid mid-term bullish trend. The MACD histogram has begun to tick higher this week, signaling improving momentum, while the RSI remains comfortably within neutral territory.
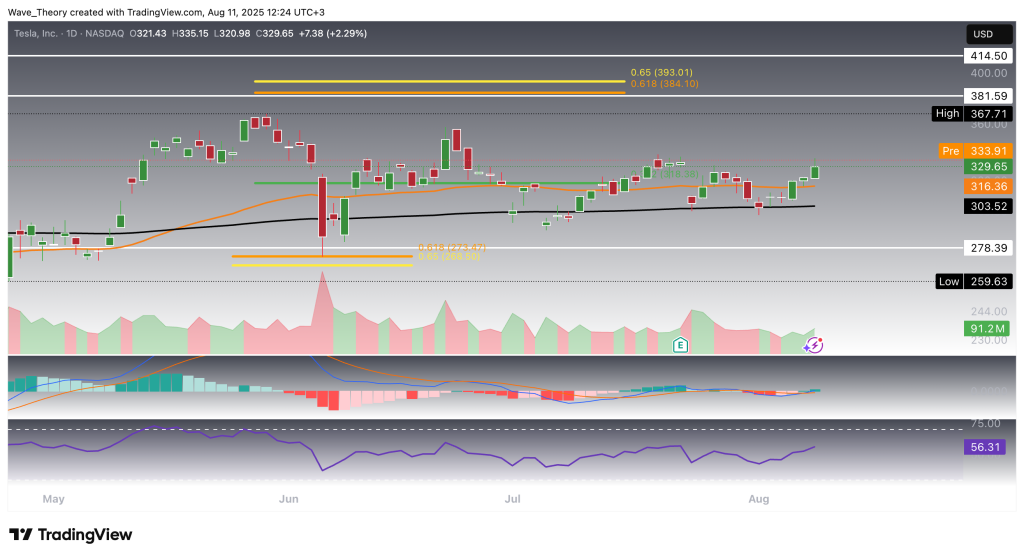
More Bullish Signals on the Daily Chart
On the daily chart, Tesla’s EMAs exhibit a golden crossover, confirming a bullish trend in the short- to medium-term. Supporting this outlook, the MACD lines are bullishly crossed, with the MACD histogram steadily ticking higher over multiple sessions. Meanwhile, the RSI holds a neutral position, indicating balanced momentum without signs of overextension.
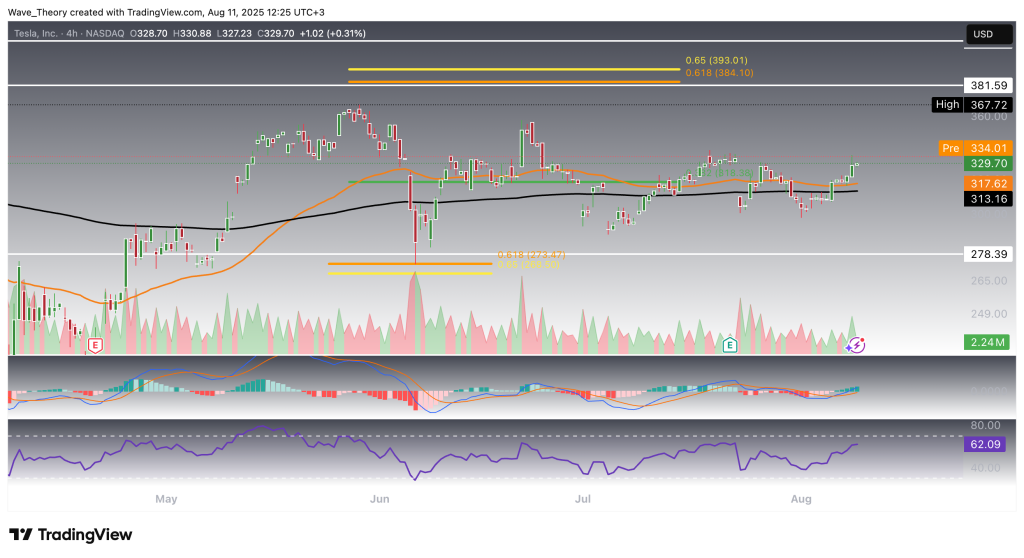
Similar Bullish Outlook on the 4H Chart
On the 4-hour chart, the technical outlook aligns closely with the daily timeframe. The EMAs maintain a golden crossover, confirming a bullish trend in the short term. Additionally, the MACD lines are bullishly crossed, accompanied by a steadily rising MACD histogram. The RSI remains in neutral territory, indicating balanced momentum.
In the near term, immediate upside potential exists, with key resistance positioned at $390 and critical support near $270.
- Check out our free forex signals
- Follow the top economic events on FX Leaders economic calendar
- Trade better, discover more Forex Trading Strategies
- Open a FREE Trading Account