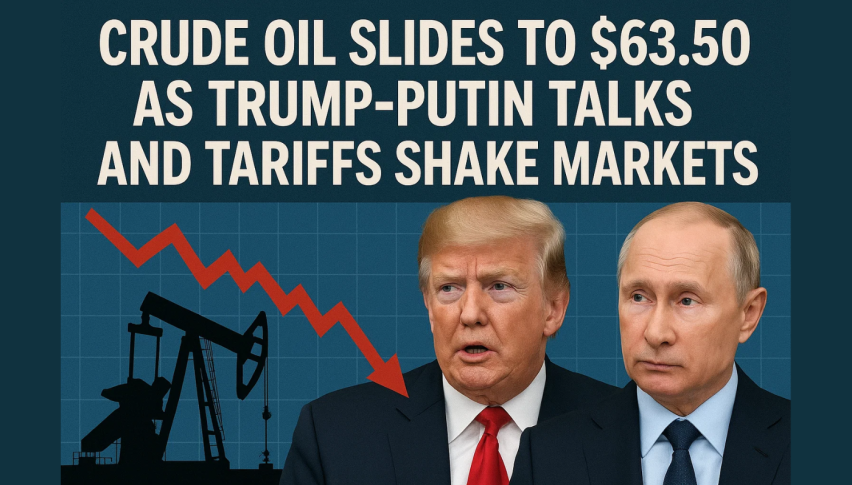
Crude Oil Slides to $63.50 as Trump‑Putin Talks and Tariffs Shake Markets
WTI crude fell about 1% on Monday and settled near $63.50, its lowest in over two months. Markets are reacting to the potential...
Quick overview
- WTI crude oil prices fell about 1% to settle near $63.50, the lowest level in over two months.
- Market reactions are influenced by potential easing of sanctions due to Trump's planned meeting with Putin, as well as new US tariffs affecting global economic activity.
- Technically, the WTI 4-hour chart shows a bearish trend with price breaking below key support levels and negative momentum indicators.
- Trading strategies suggest a short bias unless prices close above $65.00 with volume, which could indicate a shift towards bullish sentiment.
WTI crude fell about 1% on Monday and settled near $63.50, its lowest in over two months. Markets are reacting to the potential thaw in the Russia-Ukraine conflict—Trump’s announcement to meet Putin in Alaska on August 15 could ease sanctions and increase oil supply. New US tariffs on multiple trading partners are also putting downward pressure, with concerns that global economic activity—and thus energy demand—will slow down.
WTI Crude Oil (USOIL) Chart Signals Lower
Technically, WTI 4-hour chart is bearish. Price has broken below $64.73-$65.00 consolidation zone and the downtrend that started near $69 in late July. 50-SMA at $66.57 is above spot price and the bias is down. Bearish engulfing patterns and long upper wicks on failed rallies are also indicating selling pressure. Momentum indicators agree: RSI is at 35, close to oversold but not yet signaling a bounce and MACD is negative with deep red bars.
WTI Crude Oil (USOIL) Trading Setup: Short Bias
Here’s a trade idea for bulls and bears, for novice and pro traders.
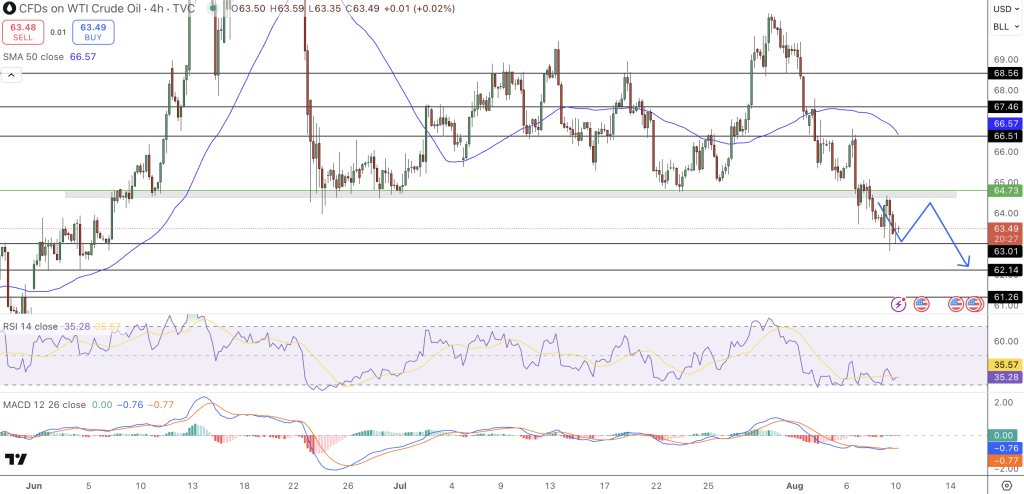
If you’re bearish (favored scenario): Wait for a pullback to $64.00-$65.00 and if rejection candles like shooting stars or bearish engulfings form, short with stop above $65.20. Initial targets could be $63.01, then $62.14 and $61.26 if momentum stays strong.
If you’re bullish (alternate): Only a close above $65.00 with volume would change the picture. That would mean some stabilization and could open the way to higher levels. Until then, sellers are in control.
- Check out our free forex signals
- Follow the top economic events on FX Leaders economic calendar
- Trade better, discover more Forex Trading Strategies
- Open a FREE Trading Account