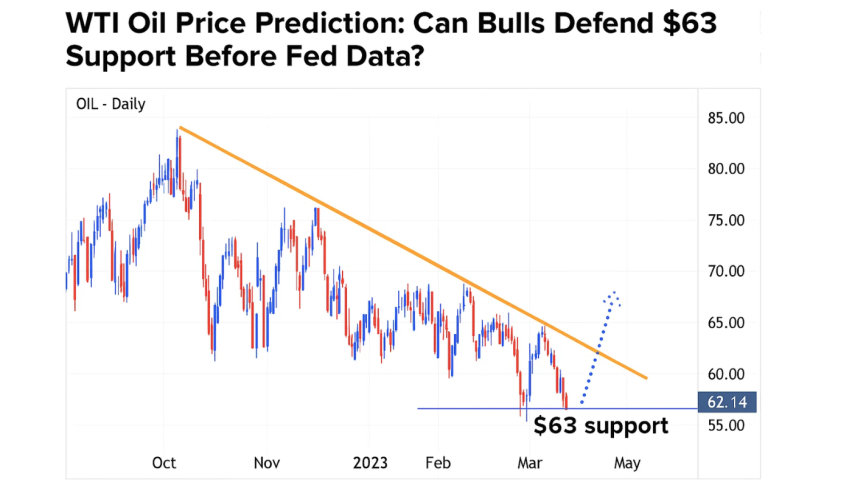
WTI Oil Price Prediction: Can Bulls Defend $63 Support Before Fed Data?
Oil prices fell in early Friday trading, unwinding some of Thursday’s gains as traders await the big meeting...
Quick overview
- Oil prices fell in early trading, with Brent down 0.4% and WTI down 0.5% as traders await the Trump-Putin meeting.
- Changes in US sanctions policy towards Russia could significantly impact global energy trade flows, particularly with Russia's oil sales to China and India.
- Market sentiment is affected by expectations of a supply surplus and slowing demand growth, with a high probability of a Fed rate cut in September.
- Traders are monitoring key resistance and support levels for WTI, with bearish and bullish scenarios depending on price movements around $63.01.
Oil prices fell in early Friday trading, unwinding some of Thursday’s gains as traders await the big meeting between US President Donald Trump and Russian President Vladimir Putin. Brent dropped 0.4% to $66.56 and WTI 0.5% to $63.63 after rising about 2% yesterday.
Any change in US sanctions policy towards Russia – OPEC’s second largest producer – could redraw global energy trade flows disrupted by the Ukraine conflict. Russia has been selling more oil to China and India at a discount and changes in sanctions could alter that.
Market sentiment is also weighed down by expectations of a supply surplus in the coming months and slowing demand growth. Traders are watching US economic data and Fed cues closely, with the CME FedWatch Tool showing over 92% probability of a 25-bp rate cut in September.
WTI Crude Oil Technical Pressure Around $64 Resistance
On the 4-hour chart, WTI is under pressure after failing to hold above the $64.08-$64.17 resistance zone which is the 50-period SMA. Since early August, price action has been stuck in a descending channel with lower highs indicating a bearish bias.
The latest rejection at the 50-SMA coincides with an RSI of 47.48, showing fading bullish momentum. MACD is slightly negative and no bullish crossover in sight, so sellers are in control.
Key levels to watch:
- Immediate resistance: $64.17
- First support: $63.01
- Secondary support: $62.14
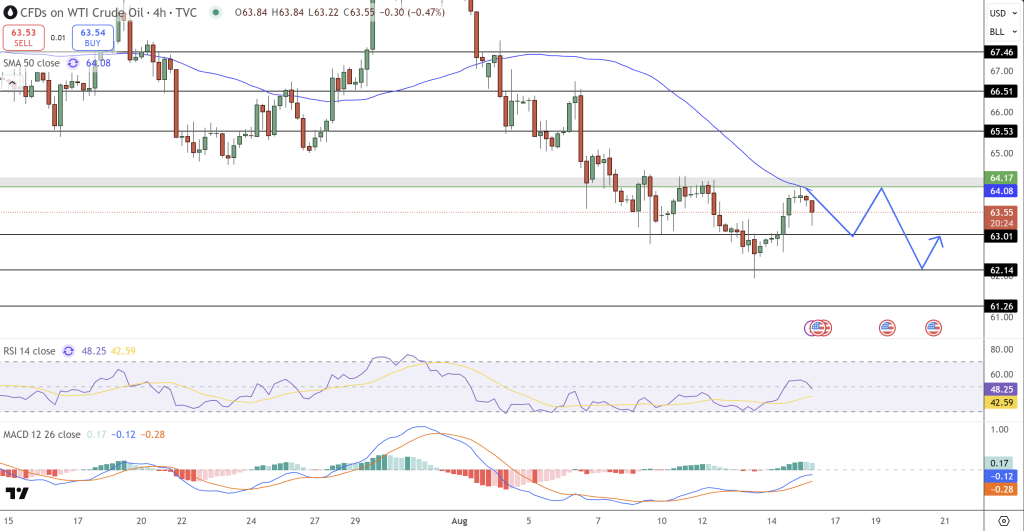
WTI Crude Oil Trade Setup: Key Scenarios
Traders have two choices depending on whether $63.01 holds or breaks.
- Bearish Scenario: A confirmed break below $63.01 could go to $62.14 and then $61.26. Stop-loss above $64.20 to avoid false breaks.
- Bullish Scenario: If price holds above $63.01 and breaks above $64.17, buyers could target $65.53 but only with strong volume.
For now, stay short on rallies until a reversal pattern appears. The Trump-Putin meeting and US data could be the trigger.
- Check out our free forex signals
- Follow the top economic events on FX Leaders economic calendar
- Trade better, discover more Forex Trading Strategies
- Open a FREE Trading Account