Solana Bulls Eye 41% Rally to $260 Target Despite Market Turbulence
Solana (SOL) is trading around $183, which is down 2.7% in the last 24 hours. However, technical analysts are still positive about the
Quick overview
- Solana (SOL) is currently trading at $183, down 2.7% in the last 24 hours, but analysts remain optimistic about a potential rebound to $260.
- Technical analysis shows a bull flag formation and a V-shaped recovery pattern, suggesting a strong possibility of upward momentum if SOL maintains support above $200.
- Despite positive technical indicators, on-chain metrics indicate a decline in network activity and trader interest, which could pose risks to SOL's price recovery.
- Key resistance levels to watch include $190, $200, and $220, while support is found at $175 and $160.
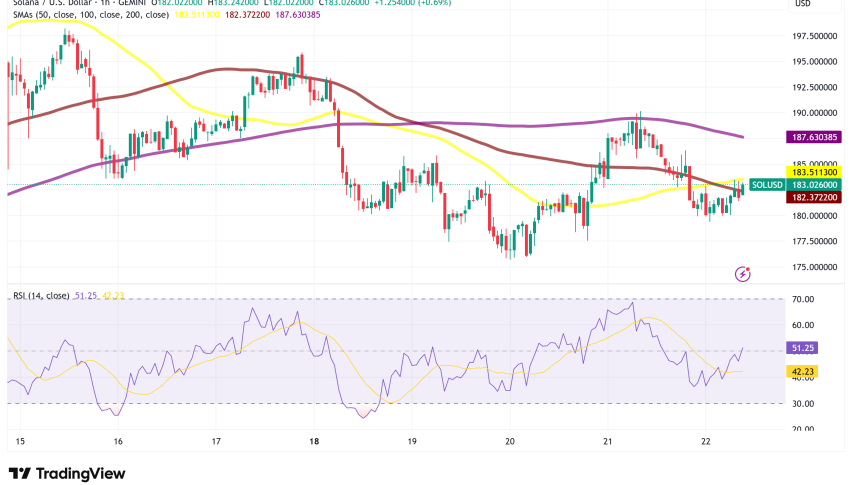
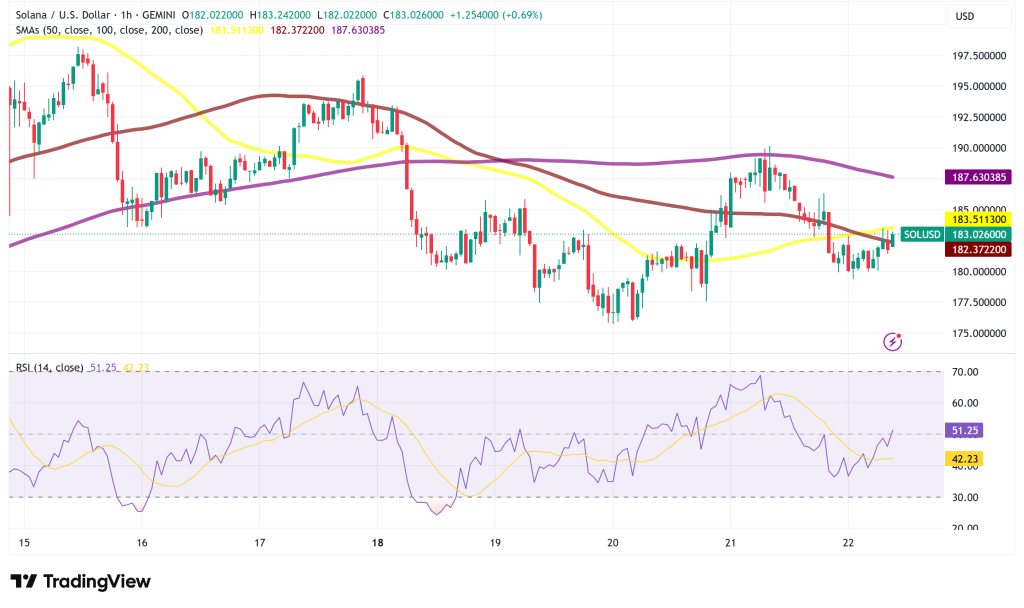
Solana SOL/USD is trading around $183, which is down 2.7% in the last 24 hours. However, technical analysts are still positive about the altcoin’s medium-term future. Even though the market has pulled back recently, several chart patterns and momentum indicators are lining up to predict a possible rebound toward the $260 price goal. This would be a big 41% gain from where the market is now.
SOL/USD Technical Analysis
Bull Flag Formation Points to Continuation Pattern
The daily period shows the most interesting technical setting for SOL, which has created a textbook bull flag pattern. This bullish continuation pattern came about after Solana’s spectacular rise to a six-month high of $209 last week, followed by a solid 16% down to $175 on Tuesday.
The bull flag pattern starts with a rapid rise, then the price stays in a falling channel for a while. SOL is now challenging the flag’s upper boundary, which is near $190. A strong close above this important level every day would probably lead to a breakthrough toward the pattern’s estimated target of about $258.
Jonathan Carter, a technical analyst, has found another ascending triangular pattern that supports the bullish premise. Carter said, “Solana is testing the upper boundary resistance again after a previous fake-out on the daily chart.” He set goals at $205, $225, and $268 if the price bounces off of present support zones.
Weekly Chart Reveals V-Shaped Recovery in Progress
Since late 2024, SOL has been making a V-shaped recovery pattern on weekly charts. This bullish reversal pattern usually means that a big trend change will happen after a steep drop. The pattern would be complete if SOL reached the neckline resistance at $260, which is very close to the daily bull flag target.
Bulls need to be able to protect the $200 level as support in order for this weekly pattern to stay intact. If the price stays above this psychological barrier for a long time, it will greatly boost the chances of hitting the $220 intermediate target before making the last push to $260.
Momentum Indicators Support Bullish Narrative
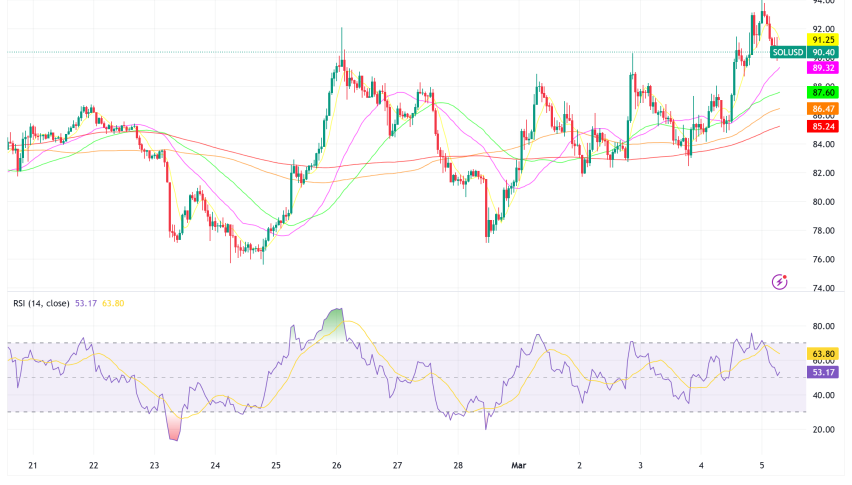
The Relative Strength Index (RSI) has gone up a lot, from 34, which was too low, to 54, which is more neutral. This shows that bullish momentum is slowly growing. As SOL stays above all the major moving averages on both daily and weekly charts, this increase in momentum happens.
SOL’s position above the 100-day and 200-day Simple Moving Averages (SMAs) on a number of timeframes, including the important 4-hour chart, is quite interesting. This technical alignment points to strong support levels that could help protect against any possible losses.
Analyst Crypto King has pointed out a “perfect bounce” from the uptrend line that connects SOL’s succession of higher lows since the low of $124 on June 22. This technical setup aims for a high goal near Solana’s all-time high of over $295.
On-Chain Metrics Present Mixed Signals
Technical indicators make things look good, but on-chain data shows several worrying tendencies that could change the course of SOL. There has been a big drop in network activity, with the number of active addresses dropping from 5.4 million in June to 2.72 million as of August 21.
Open interest has also gone down by 3.46%, which means that traders are less interested in making risky bets. Liquidation data from the past week shows that bulls have regularly had to deal with more liquidation than bears. This shows that people are less confident in upward momentum.
However, favorable factors include DeFi’s growing dominance on Solana’s network, rising transaction fees, and consistently excellent throughput, all of which continue to boost long-term investor confidence.
Market Context and Risk Factors
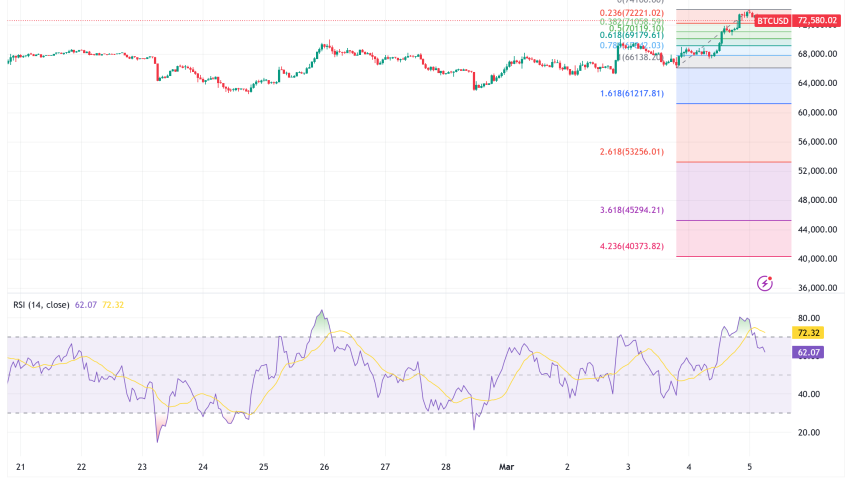
The recent drop in SOL’s price is in line with problems in the broader cryptocurrency market, where major assets like Bitcoin and Ethereum have lost about 5% of their value in the past week. The market-wide selloff is due to macroeconomic concerns, such as inflation data that was higher than expected and indicators that the U.S. job market is slowing down.
The MACD indicator has turned negative, and the fact that trade volume is going down shows that the markets are waiting for better macroeconomic indications before setting new patterns. Jerome Powell, the head of the Federal Reserve, is going to give a speech soon that might be quite important, especially if he hints at interest rate decreases in September.
Solana Price Prediction and Key Levels to Watch
The $260 level, where the bull flag and V-shaped recovery patterns meet, is still the major goal for SOL. This is because technical patterns are coming together. This means that costs could go up by 41% to 43% from where they are now.
$190 (the upper boundary of the bull flag), $200 (psychological support turned resistance), and $220 (an intermediate target) are all important resistance levels. On the other hand, important support is at $175 (the most recent swing low) and $160 (a possible deeper retracement level).
A clear daily close over $190 would be the first thing that would cause prices to go up. This may quickly speed up the process of finding prices in the $205-$225 region before moving on to the final $260-$268 zone.
- Check out our free forex signals
- Follow the top economic events on FX Leaders economic calendar
- Trade better, discover more Forex Trading Strategies
- Open a FREE Trading Account
- Read our latest reviews on: Avatrade, Exness, HFM and XM