Tilray (TLRY) Stock Soars 290% in 2025 Rally — But Still 99.6% Below All-Time High

Quick overview
- Tilray (TLRY) has surged over 290% in the past three months, sparking renewed interest in cannabis stocks.
- Despite this rally, Tilray's shares are still nearly 99.6% below their all-time high, raising questions about the sustainability of this momentum.
- The stock has broken above the 50-week EMA resistance at $0.95, indicating potential for further upside, but remains in a long-term downtrend.
- Key support levels at $0.98 and $0.70 are critical, as a breakdown could lead to new lows, while a golden crossover suggests short-term bullish potential.
Tilray (TLRY) has delivered a staggering rally of more than 290% over the past three months, reigniting investor interest in cannabis stocks. Yet, despite this explosive rebound, shares remain crushed—trading nearly 99.6% below their all-time high. The key question now: does this momentum signal the beginning of a sustainable recovery, or is it merely a short-lived bounce?
Tilray Stock Surges 290% in Less Than Three Months
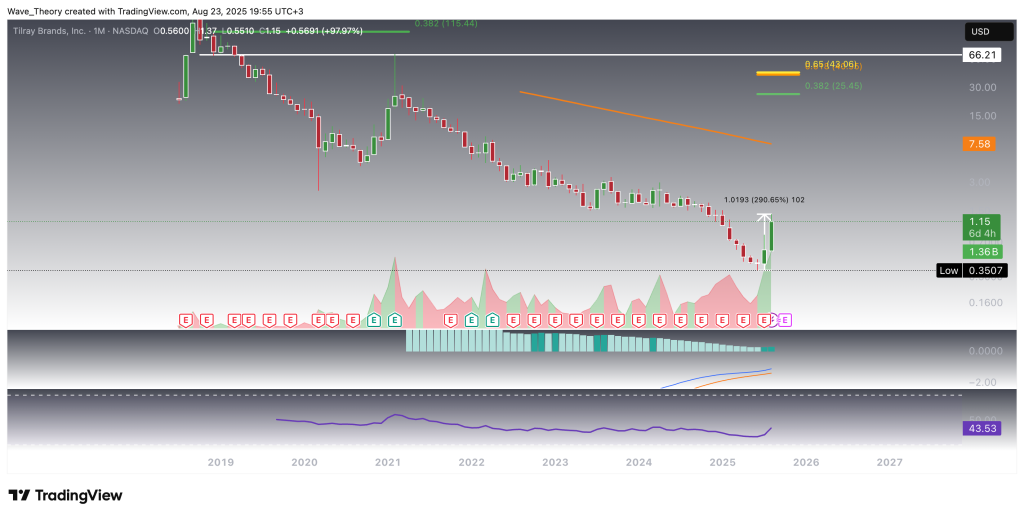
Since June, Tilray has rallied approximately 291%, with the bulk of this advance occurring over the past seven weeks. The momentum is reflected in the MACD histogram, which has been printing higher bullish bars since last month, while the MACD lines remain in a bullish crossover. In contrast, the RSI remains neutral, offering neither bullish nor bearish signals at this stage.
From a structural perspective, a true mid-term conclusion to Tilray’s prolonged correction would require a breakout above the golden ratio resistance at $43 — a level that sits nearly 40x above current prices. Importantly, Tilray also faces several nearer-term resistance zones well before approaching this threshold.
In sum, despite the magnitude of its recent rally, Tilray remains entrenched in a long-term downtrend, with significant technical hurdles ahead before a broader reversal can be confirmed.
Tilray Stock Successfully Breaks Above 50-Week EMA Resistance at $0.95
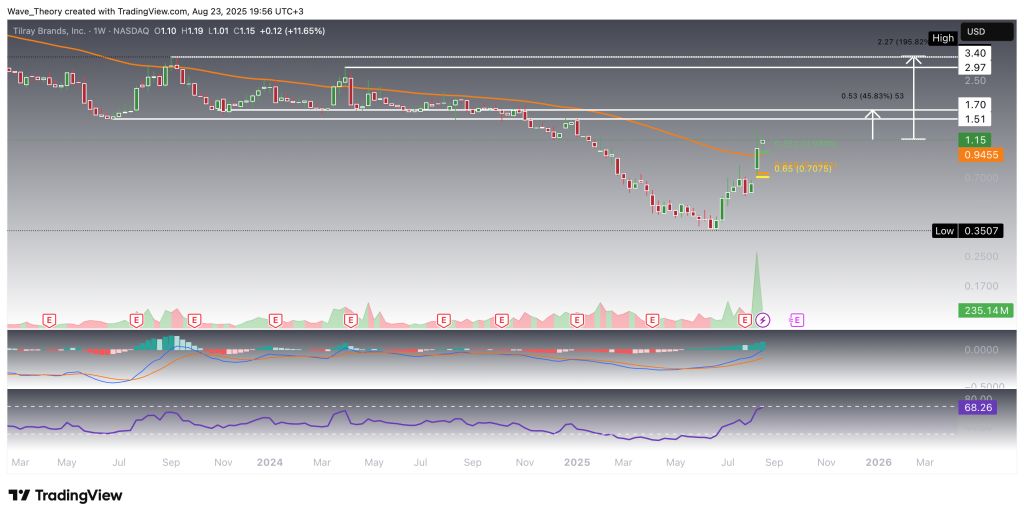
Tilray has decisively broken through the 50-week EMA resistance at $0.95, marking a significant technical development. This breakout opens the door for a potential 46% upside move, targeting the horizontal resistance zone between $1.50 and $1.70.
Momentum indicators support this bullish outlook: the MACD lines remain positively crossed, while the MACD histogram has printed higher bullish ticks for three consecutive weeks, reflecting strengthening momentum.
Should Tilray sustain its upward trajectory and break through the $1.70 resistance, the next key target lies in the $2.97–$3.40 resistance zone, which represents an additional ~196% potential upside from current levels.
Despite this strong technical recovery, it is worth noting that Tilray remains entrenched in a broader long-term downtrend, and even sustained closes above these resistance levels would not confirm a true reversal.
Tilray Stock Holds Above Key Fibonacci Support as Golden Crossover Nears
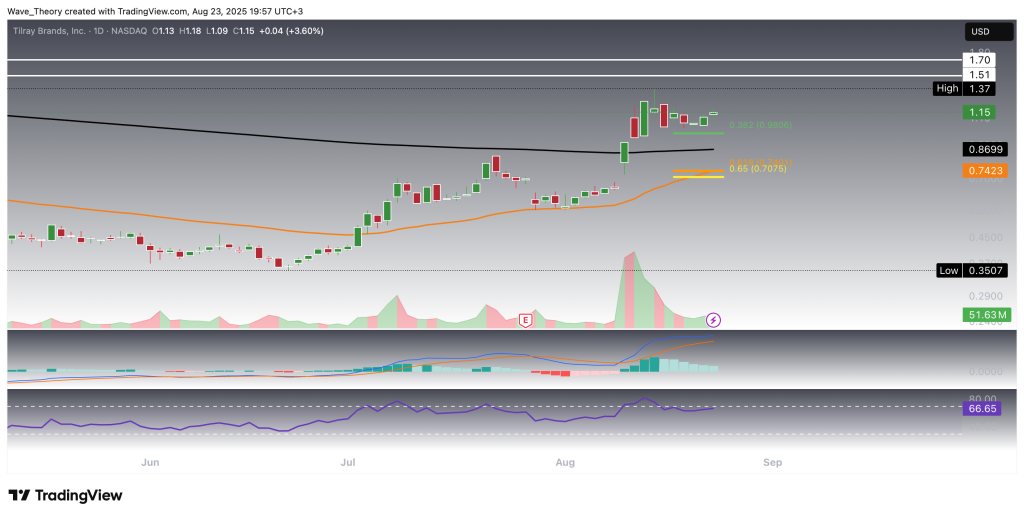
Tilray (TLRY) has been undergoing a short-term correction over the past week, but the stock continues to hold above the crucial 0.382 Fibonacci retracement support at $0.98. A breakdown below this level could open the way to the next significant Fib support at $0.70, where the 50-day EMA also provides additional reinforcement near $0.74.
Meanwhile, the moving averages are converging, raising the possibility of a golden crossover—a bullish technical pattern that could confirm an upward trend in the short- to medium-term outlook.
From a momentum perspective, the MACD histogram is still trending lower, but the MACD lines remain bullishly crossed. The RSI, currently hovering near overbought territory, does not yet provide a clear directional signal.
Golden Crossover Established on the 4H Chart of Tilray Stock
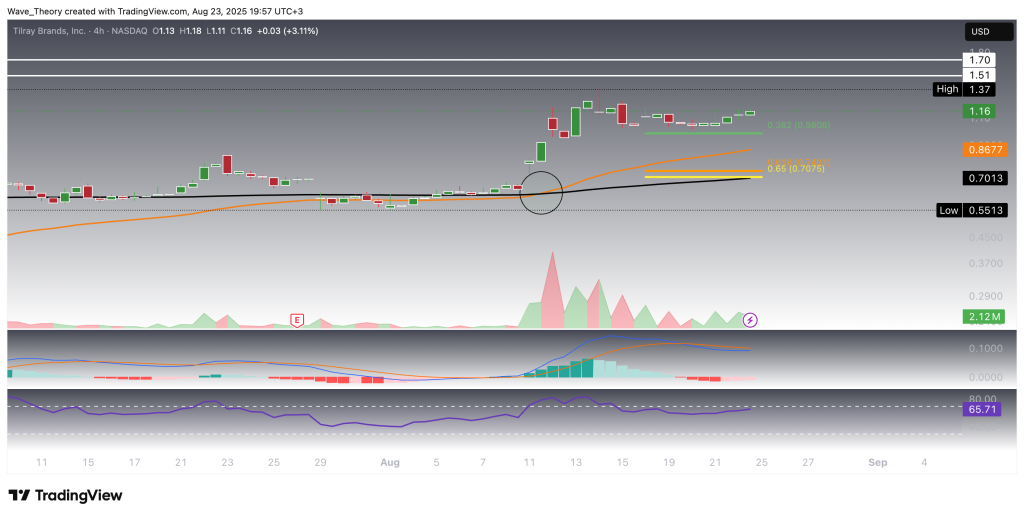
On the 4-hour chart, Tilray stock (TLRY) has already established a golden crossover, confirming the trend as bullish in the short term. In addition, the MACD histogram is currently ticking higher, signaling increasing bullish momentum. However, the MACD lines remain bearishly crossed, while the RSI is hovering in neutral territory.
Although there is still upside potential in the short term, the long-term downtrend for Tilray remains intact. Key support levels lie at $0.98 and $0.70, which could serve as potential entry points for bullish investors. A bearish break below these supports, however, could push Tilray stock to new lows.
- Check out our free forex signals
- Follow the top economic events on FX Leaders economic calendar
- Trade better, discover more Forex Trading Strategies
- Open a FREE Trading Account
- Read our latest reviews on: Avatrade, Exness, HFM and XM
Related Articles