WTI Crude Oil Holds Near $64 as Tariff Tensions and Fed Signals Drive Outlook
WTI crude oil futures held steady near $64 on Monday after last week’s bounce as markets weighed geopolitical...
Quick overview
- WTI crude oil futures remained steady near $64 as markets assessed geopolitical risks and monetary policy signals.
- Supply concerns arose after the US threatened to increase tariffs on Indian imports due to continued purchases of Russian crude.
- Indian refiners plan to maintain their sourcing from Russia despite US pressure, while investors remain cautious ahead of a tariff deadline.
- Technical indicators suggest a potential bullish continuation for WTI crude, with key resistance levels identified for traders.
WTI crude oil futures held steady near $64 on Monday after last week’s bounce as markets weighed geopolitical risks and monetary policy signals. Supply concerns took center stage after the US threatened to double tariffs on all imports from India to 50% in retaliation for New Delhi’s continued purchases of Russian crude. India is one of the world’s largest importers and a key driver of demand.
Despite the US pressure, Indian refiners said they would continue to source from Moscow, easing fears of immediate demand destruction. But investors remain cautious ahead of Wednesday’s tariff deadline. Meanwhile, stalled Russia-Ukraine peace talks reignited concerns about disruptions to global energy flows as both sides intensified attacks on each other’s energy infrastructure.
Adding a macro layer, Fed Chair Jerome Powell hinted Friday that rate cuts could resume as soon as next month. Lower rates would support global growth and energy demand, especially as the dollar softens and makes crude more attractive to overseas buyers.
WTI Crude Oil Technicals Point to Upside
WTI crude is staging a measured recovery, trading at $63.77 after rebounding from last week’s $60.84 low. On the 2-hour chart, the price has broken the descending trendline and is consolidating just below $64.31 resistance, which capped gains earlier this month.
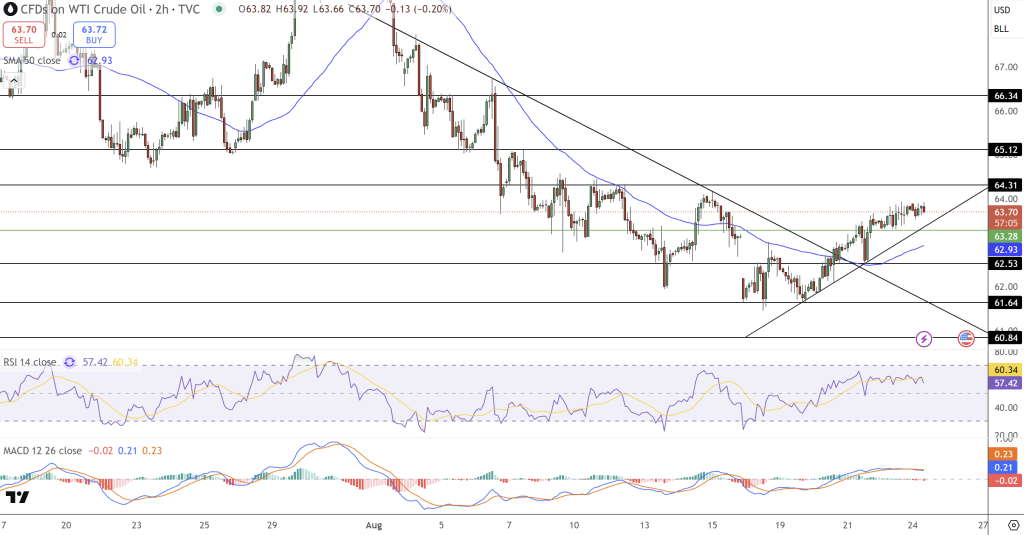
The rising trendline from August 19 shows a series of higher lows – often a sign of bullish continuation. The 50-period SMA at $62.93 has turned into support, in line with trendline strength. Momentum indicators agree: RSI is at 59, not overbought, and MACD has crossed above zero, a sign of stabilizing bullish momentum. Candlesticks also show accumulation, with long green bars at $62.50 and smaller-bodied candles at $64.
USOIL Trade Setup: $66 in Focus
For traders, it’s simple. A close above $64.31 opens up $65.12 and if momentum accelerates, $66.34. Stops can be placed below $62.90, under both the SMA and trendline support.
- Check out our free forex signals
- Follow the top economic events on FX Leaders economic calendar
- Trade better, discover more Forex Trading Strategies
- Open a FREE Trading Account
- Read our latest reviews on: Avatrade, Exness, HFM and XM
Related Articles
Sidebar rates
Related Posts
