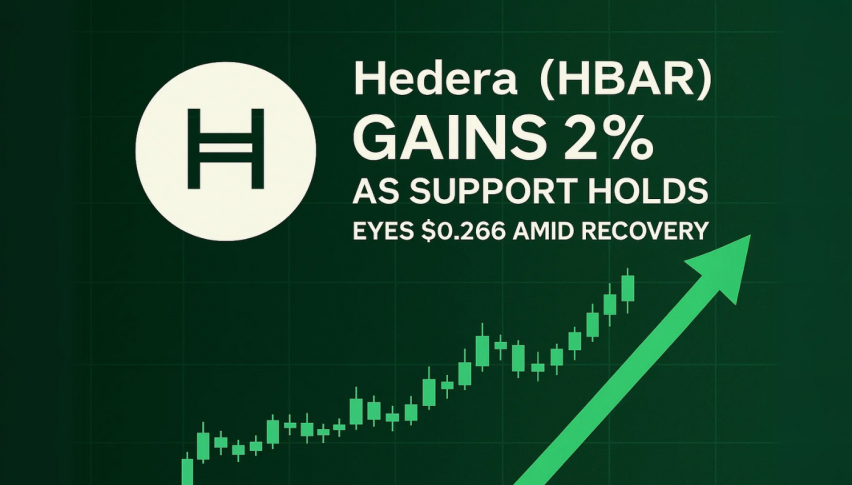
Hedera (HBAR) Gains 2% as Support Holds, Eyes $0.266 Amid Recovery
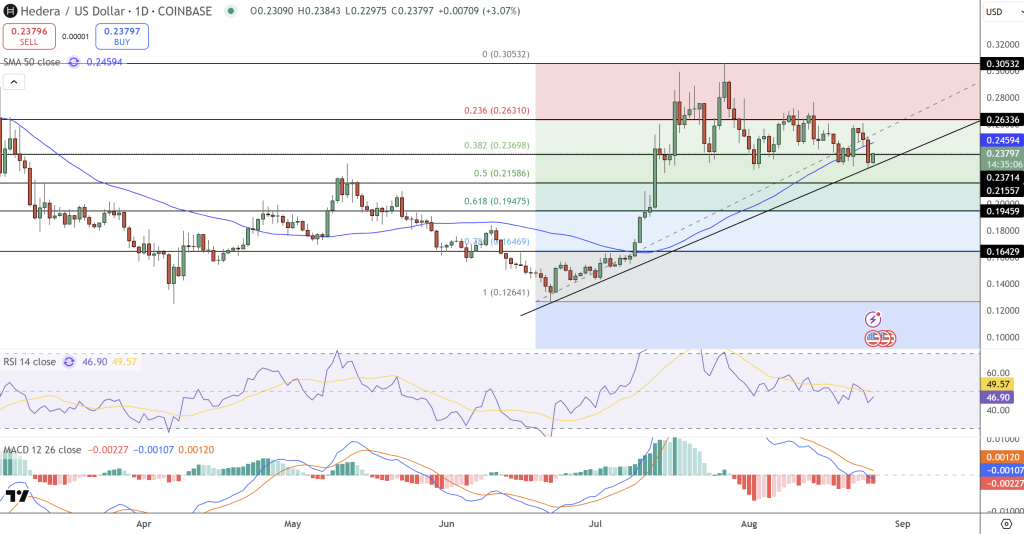
HBAR up 1.95% as it finds support at $0.22885. HBAR has reversed a three day decline as it found support at $0.22885.
Quick overview
- HBAR has increased by 1.95% after finding support at $0.22885, reversing a three-day decline.
- Traders are cautiously optimistic, but mixed technical signals suggest potential consolidation before a significant upward move.
- Open Interest in HBAR derivatives has decreased, indicating capital outflow, while the taker buy percentage has risen.
- The price outlook for HBAR hinges on maintaining support above the 50-day EMA at $0.23643 to target higher resistance.
HBAR up 1.95% as it finds support at $0.22885. HBAR has reversed a three day decline as it found support at $0.22885. Traders are slowly getting optimistic again. But the technicals are mixed so we may see consolidation before any big move up.
- Current price: +1.95%
- Key support: $0.22885
- Resistance in focus: 50 day EMA at $0.23643
If HBAR holds above this support it could retest higher resistance and fuel more bullish sentiment.
HBAR Derivatives Show Mixed Signals
CoinGlass shows HBAR Open Interest (OI) fell to $391.83M on Tuesday from $409.16M on Monday. OI is down and taker buy is up. This means capital is flowing out and HBAR derivatives are getting liquidated. Traders are cautious.
- OI: $391.83M
- Taker buy: 48.55% (up from 47.63%)
- Long-to-short ratio: 0.9436
Despite lower OI, taker buy is up. Traders are watching these indicators for a recovery, balancing short term caution with long term bullish bets.
HBAR Price Outlook: Recovery or Consolidation
After bouncing from support, HBAR is targeting the 50 day EMA at $0.23643. If it closes above this line it could drive momentum to $0.26606 last tested on August 14.
Technicals:
- MACD: approaching zero line, bearish if crossed
- RSI: 45, below neutral, cautious
- Downside risk: 100 day EMA at $0.22033
Watch the 50 day EMA. If HBAR can’t hold above this it could go down to the 100 day EMA. If it does hold above this it could be a buying opportunity and set up a bigger recovery.
- Check out our free forex signals
- Follow the top economic events on FX Leaders economic calendar
- Trade better, discover more Forex Trading Strategies
- Open a FREE Trading Account
- Read our latest reviews on: Avatrade, Exness, HFM and XM
Related Articles
Sidebar rates
Related Posts
