PEPE Price Slides 9.9% as Whale Support Drops to 41,058 Wallets
PEPE (PEPE) is up 1% today after a 9.88% drop below the $0.00001000 psychological level on Monday. Market data shows...
Quick overview
- PEPE is up 1% today after a significant drop below the $0.00001000 level, with expectations of further downside.
- Large investors are pulling out, with a decrease in wallets holding significant amounts of PEPE, indicating weakening whale participation.
- The derivatives market shows bearish sentiment, with open interest down 8% and negative funding rates suggesting a sell-side control.
- PEPE is testing critical support levels, and analysts warn that a close above $0.00001000 is needed for a meaningful bounce.
PEPE (PEPE) is up 1% today after a 9.88% drop below the $0.00001000 psychological level on Monday. Market data shows large investors are pulling out, and more downside is expected.
According to Santiment, wallets with 100M-1B PEPE have dropped to 41,058 from the monthly high of 41,506 on August 9. Addresses with over 1B PEPE have dropped to 9,725 from the high of 9,815 on August 15.
- Total supply in profit is at a 2 month low of 37.63%.
- A smaller percentage of “in the money” tokens means more overhead pressure.
Whale participation is weakening, and the meme coin market is at risk of more selling.
I've been watching $PEPE's on-chain activity. The holder distribution is consolidating, not diluting, which is rare for a meme of that size. Reminds me of the early days grinding for rare loot drops. Feels like a community, not just a pump.
— Yohan Lee (@voxel_yohan) August 26, 2025
Derivatives Show Capital Outflow
CoinGlass reports PEPE’s open interest is down 8% in the last 24 hours to $556.95M. Outflows like this are often caused by futures and options liquidations and means investors are losing confidence.
- Funding rates are negative -0.0168% which means sell side is in control.
- Long/short ratio is 0.8975 which means more shorts than longs.
The derivatives market is telling us bearish sentiment is in control and traders are positioning for more downside.
PEPE Key Support Levels Under Threat
After the bounce, PEPE is testing the $0.00000986 support-turned-resistance level. Analysts say the path of least resistance is down and could test the $0.00000900 demand zone.
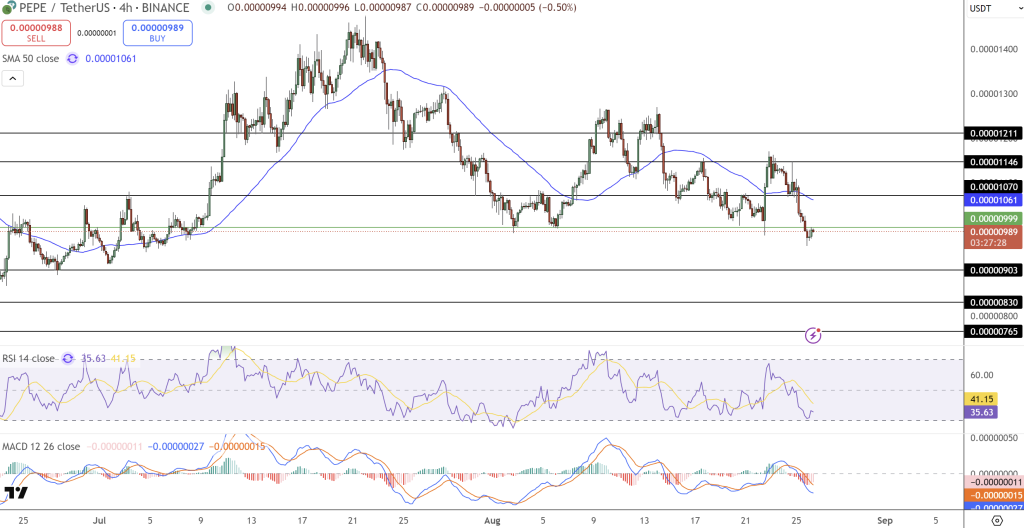
- Daily chart is forming a death cross as 50-day and 100-day EMAs are converging with the 200-day EMA.
- Momentum indicators are bearish: MACD is in negative territory and RSI is at 40 and nearing oversold.
For a meaningful bounce, PEPE needs to close above $0.00001000 which could open up the 200-day EMA at $0.00001115. Until then, traders should be cautious with the bearish pressure.
- Check out our free forex signals
- Follow the top economic events on FX Leaders economic calendar
- Trade better, discover more Forex Trading Strategies
- Open a FREE Trading Account
- Read our latest reviews on: Avatrade, Exness, HFM and XM