Crude Oil Forecast: WTI Slides to $63.8 Amid Driving Demand Dip & India Tariff Tensions
Oil prices reacted to the end of peak summer driving and heightened U.S.–India tariff tensions, reinforcing market caution.
Quick overview
- WTI crude settled near $63.80 as the summer driving season ends, with a larger than expected draw in US crude inventories providing short-term bullish sentiment.
- Analysts anticipate a quick fade in demand post-Labor Day, while traders monitor India's response to new US tariffs on Russian oil imports.
- Despite tariff concerns, India is expected to maintain steady imports, limiting global supply impacts.
- Traders should consider shorting below $62.95 or waiting for a break above $65.12 to target higher resistance levels.
WTI crude settled near $63.80 on Thursday as the summer driving season winds down. A bigger than expected draw in US crude inventories – 2.4 million barrels vs 1.9 million – should be short term bullish especially ahead of Labor Day.
But analysts say demand usually fades quickly post holiday. Traders are also watching how India responds to new US tariffs as Washington imposes 50% penalty on New Delhi for buying Russian oil.
While the tariffs are a concern, analysts expect India to keep imports steady in the near term so global supply impacts will be limited. Meanwhile, Russia-Ukraine energy strikes and a potential US rate cut are giving bulls some support.
Crude Oil (USOIL) Resistance at $64–65
On the 2 hour chart, crude is consolidating after breaking out of the rising channel. Immediate resistance is between $64–65 where the 50 period moving average (SMA) is at $63.82 and capping upside.
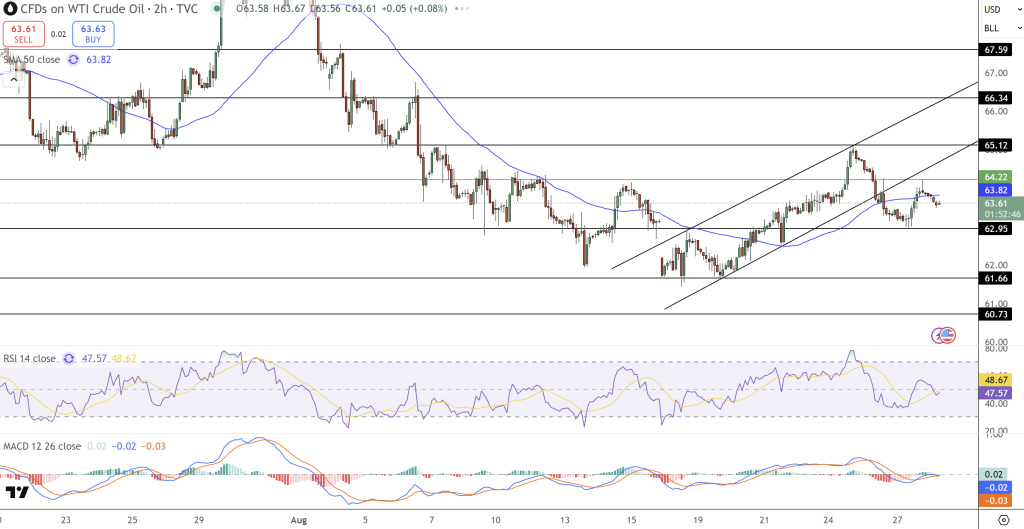
The RSI is 47 and neutral but downward, the MACD is flat and cautionary. Recent candlesticks with upper wicks at $64.20 show seller dominance in higher areas. Support is at $62.95 with further layers down at $61.66 and $60.73 – levels to test if bearish momentum resumes.
What to Do Now
For traders, it’s simple. Aggressive sellers can look to short below $62.95 and target the lower support zones at $61.66–$60.73 with stops above $64.20.
Meanwhile, patient buyers can wait for a break above $65.12 – a clean break of resistance – and then target $66.34 and $67.59.
- Check out our free forex signals
- Follow the top economic events on FX Leaders economic calendar
- Trade better, discover more Forex Trading Strategies
- Open a FREE Trading Account
- Read our latest reviews on: Avatrade, Exness, HFM and XM