Forex Signals Brief August 28: US Core PCE Inflation Ticks Up, Canadian GDP Dips
The US dollar extended its decline as traders weighed stronger PCE inflation signals from the US against lackluster Canadian GDP figures...

Quick overview
- The US dollar continued its decline against major currencies as traders reacted to mixed economic signals.
- Switzerland's GDP growth was weak at 0.1%, indicating sluggish domestic activity amid global uncertainties.
- US GDP was revised upward to 3.3%, but the impact on market sentiment was limited as traders focused on positioning shifts.
- Canadian GDP showed signs of weakness, with a projected mild rebound, leading to increased expectations for rate cuts by the Bank of Canada.
Live BTC/USD Chart
The US dollar extended its decline as traders weighed stronger PCE inflation signals from the US against lackluster Canadian GDP figures, both pointing to shifting momentum in currency markets.
Dollar Extends Losses Against Major Currencies
The decline in the U.S. dollar, which began during the previous trading session, continued into today as the greenback lost further ground against the other major currencies. Market sentiment appeared to favor risk assets, with investors reassessing their positions despite economic data that, under different circumstances, might have offered some support to the dollar. The move suggested that broader shifts in positioning and market psychology were weighing more heavily on FX dynamics than the data itself.
Swiss GDP Shows Weak Momentum
Switzerland’s GDP data added another layer to today’s market narrative. Quarterly GDP growth came in at 0.1% for the second quarter, highlighting very modest economic expansion. At the same time, the prior quarter’s result was revised downward, further underscoring weakness in the Swiss economy. The subdued reading reflected sluggish momentum in domestic activity, even as Switzerland’s export-driven economy continues to contend with broader global uncertainties.
U.S. GDP Revision Beats Expectations
In the United States, second-quarter GDP revision figures showed the economy expanding at an annualized pace of 3.3%, an improvement from the preliminary estimate of 3.0%. However, this was still slightly below the 3.1% projection. While the upward revision pointed to resilience in economic activity, investors treated the report largely as backward-looking information, given that Q2 has already concluded and markets are forward-facing. As such, despite the stronger reading, the impact on trading sentiment was limited.
Labor Market Remains Resilient
Meanwhile, U.S. labor market data reinforced the picture of underlying strength. Initial jobless claims fell to 229,000, beating expectations of 232,000 and improving from the prior week’s 235,000. Typically, this combination of a firmer labor market alongside stronger GDP data would provide a tailwind for the U.S. dollar, reflecting ongoing economic resilience. However, the muted FX reaction revealed that traders were more focused on positioning shifts and broader changes in market sentiment, rather than reacting directly to the fundamentals.
Key Market Events Today
US PCE Inflation
- US Core PCE for July YoY 2.9% vs 2.9% expected
- Prior 2.8%
- Core PCE M/M 0.3% vs 0.3% expected
- Prior 0.3%
Headline PCE:
- PCE Y/Y 2.6% vs 2.6% expected
- Prior 2.6%
- PCE M/M 0.2% vs 0.2% expected
- Prior 0.3%
Income/Spending:
- Personal income M/M 0.4% vs 0.4% expected
- Prior 0.3%
- Personal spending M/M 0.5% vs 0.5% expected
- 0.3% prior (revised to 0.4%)
Canadian GDP: Growth Falters
In contrast, Canadian GDP showed signs of weakness. May output fell 0.1%, but Statistics Canada projected a mild rebound of +0.1% in June. This leaves Q2 annualized growth hovering near 0.1%, narrowly avoiding contraction after a solid Q1.
Minutes from the Bank of Canada’s latest meeting revealed a split: while some policymakers argued the economy had sufficient support, others saw the need for additional measures. With inflation easing more than expected, markets are increasingly pricing in policy easing. Traders now assign a 96% probability of a rate cut by year-end, with 24 basis points of cuts implied.
Last week, markets were quite volatile once, with gold retreating and then bouncing to finish the week close to $4,000 but yesterday it retreated again. EUR/USD continued the upward move toward 1.17, while main indices closed higher. The moves weren’t too big though, and we opened 35 trading signals in total, finishing the week with 23 winning signals and 12 losing ones.
Gold Approaches $3,400
Gold also joined the rally: after briefly dipping below $3,268/oz following the Fed’s steady-rate decision, the metal climbed nearly $200 higher by week’s end. Strong safe-haven demand and stable labor data lifted prices above the 100-day SMA, reinforcing bullish momentum. Technicals continue to highlight the $3,450–$3,500/oz zone as the next key breakout area.
Yen Recovery from ¥150 Shock
Foreign exchange markets saw sharp swings. Early in the week, U.S. yield differentials and Japanese capital outflows pushed the dollar above ¥150, but disappointing U.S. jobs data triggered profit-taking, causing the USD/JPY to slide by four yen from its peak. The move underscored persistent volatility as traders weighed Japan’s intervention risks against evolving Fed expectations.
USD/JPY – Weekly Chart
Cryptocurrency Update
Bitcoin Returns Above $110K after Finding Support
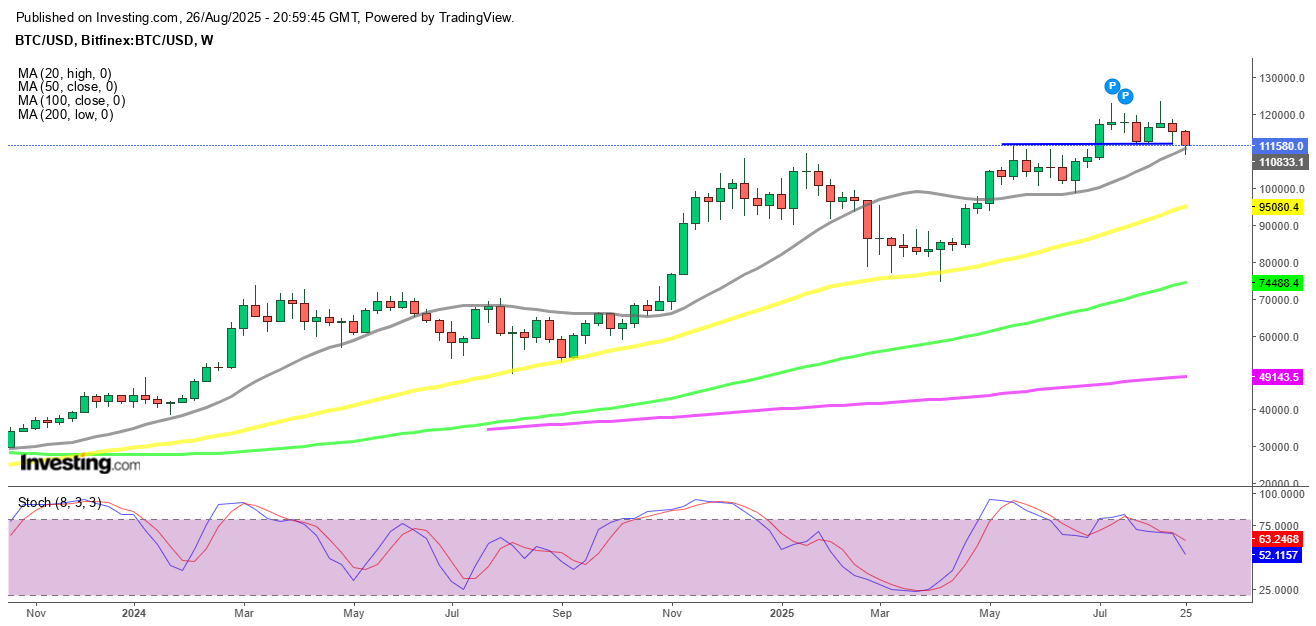
Cryptocurrencies remained highly active over the summer. Bitcoin (BTC) climbed to fresh highs of $123,000 and $124,000 in July and August, supported by institutional inflows and technical strength. However, remarks from Treasury Secretary Scott Bessent ruling out U.S. increases to BTC reserves triggered a steep pullback, sending the coin down to $113,000 before recovering above $116,000 last week, however sellers returned and sent BTC below $110,000, however we saw a rebound off the 20 weekly SMA (gray) yesterday.
BTC/USD – Weekly chart
Ethereum Reclaims the $4,500 Level
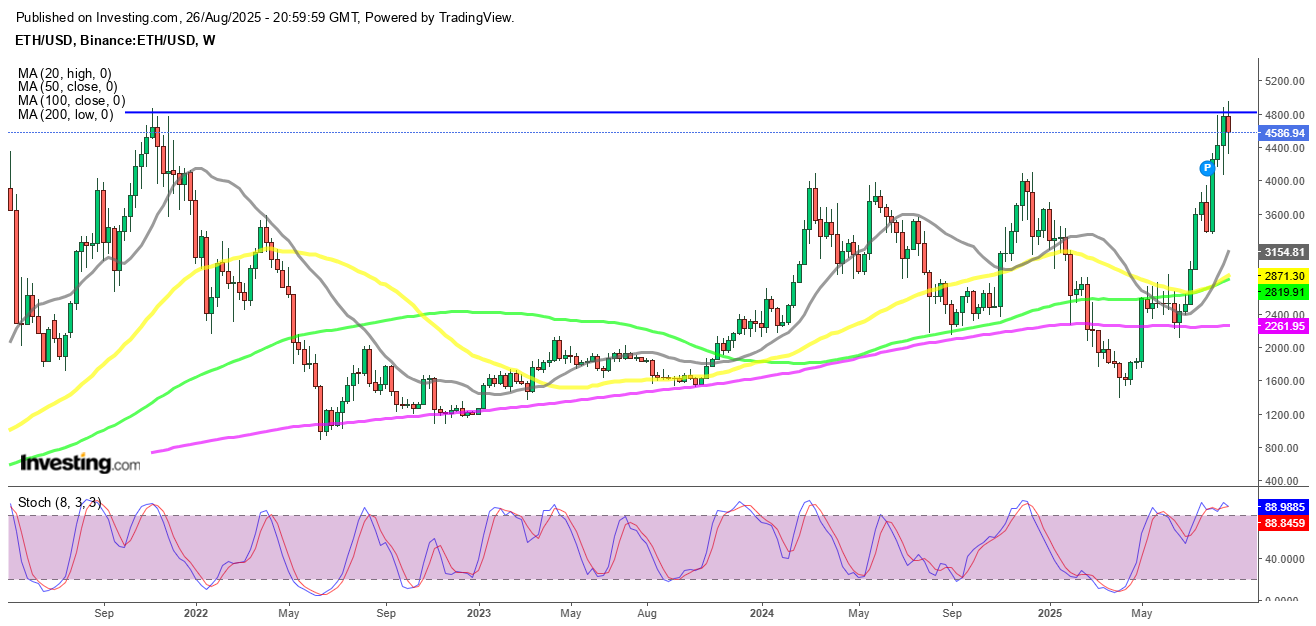
Ethereum (ETH) has been similarly strong, surging toward $4,800, its highest since 2021 and near its all-time peak of $4,860. Despite a dip last week, ETH found support at the 20-day SMA, with retail enthusiasm and renewed institutional participation driving fresh upside momentum. However buying resumed and on Sunday ETH/USD printed another record at $4,941. However we saw a retreat to $,000 lows over the weekend, but yesterday buyers returned.
ETH/USD – Daily Chart
- Check out our free forex signals
- Follow the top economic events on FX Leaders economic calendar
- Trade better, discover more Forex Trading Strategies
- Open a FREE Trading Account


