WTI Crude Dips to $63 as OPEC+ Weighs 1.65M bpd Supply Shift and Rising Stocks
WTI crude futures fell to $63 per barrel on Thursday, down 2.5% as traders await this weekend’s OPEC+ meeting.
Quick overview
- WTI crude futures dropped to $63 per barrel, down 2.5%, as traders await the OPEC+ meeting on output cuts.
- US crude inventories unexpectedly rose by 622,000 barrels, raising concerns about weaker demand amid slowing US growth.
- Technical analysis indicates bearish momentum for WTI, with key support levels at $62.95 and $62.10.
- Traders are advised to consider short positions near $63.60-$63.70, with targets set for lower support levels.
WTI crude futures fell to $63 per barrel on Thursday, down 2.5% as traders await this weekend’s OPEC+ meeting. The group will discuss unwinding 1.65 million bpd of output cuts – 1.6% of global demand. This comes after OPEC+ already raised quotas by 2.5 million bpd from April to September, including an extra 300,000 bpd for the UAE. However, actual supply increases have often lagged behind pledges due to overproduction adjustments and limited spare capacity among some members.
Inventory Build Signals Weak Demand
Bearishness intensified after US crude inventories rose 622,000 barrels last week, vs 3.4 million draw expected. The surprise build reinforces concerns about weaker consumption at a time when supply may increase. Economic data showing slowing US growth adds to demand worries. If OPEC+ boosts output, the market may be in for a bigger imbalance.
Oil prices fell 1% on Thursday, with Brent at $66.96 and WTI at $63.33, extending the previous session’s decline. Markets await the OPEC+ meeting on Sunday, where output increases may be considered, while weak US jobs data and a surprise crude stock build weighed on sentiment. pic.twitter.com/gPx5d6KjEu
— Adeel Afzal (@AdeelAfzal06) September 4, 2025
Key points:
- OPEC+ to unwind 1.65 million bpd of cuts (1.6% of global demand).
- US crude inventories up 0.6 million barrels vs 3.4 million draw expected.
- Market already fragile due to slower US growth.
WTI Crude Oil (USOIL) Technicals Show Bearish Momentum
From a chart perspective, WTI broke below the ascending trendline and the 50-SMA at $64.20. Three red candles in a row (three black crows) is bearish. RSI is at 35, near oversold. 200-SMA at $65.13 is resistance. Support is at $62.95, then $62.10 and $61.44.
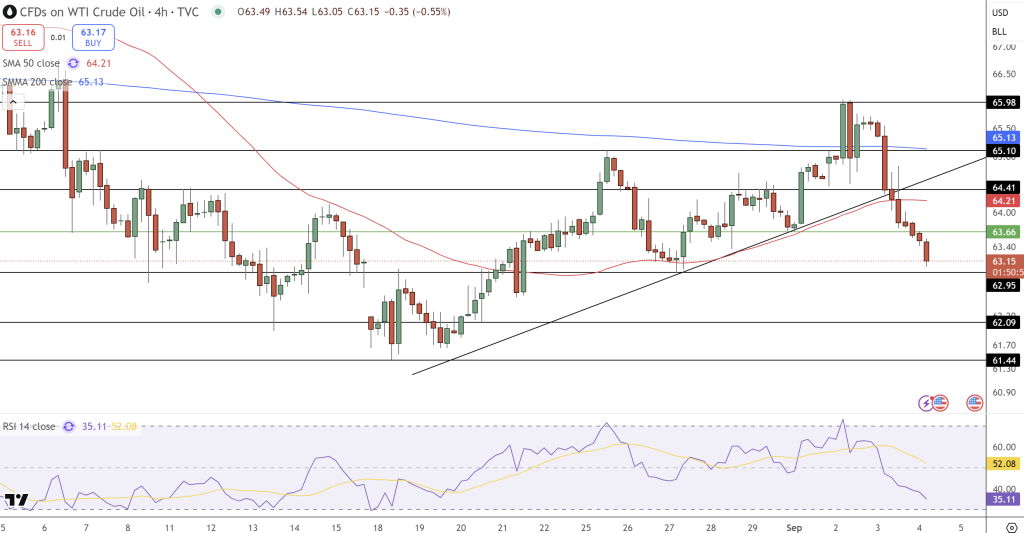
For traders, the setup is short-term bearish. Entry is near $63.60-$63.70 on a failed retest of broken support, with stops above $64.50. Targets are $62.95 first, then $62.10 if it goes lower. Bottom line: oil’s structure has broken and the market is gearing up for a correction as supply and demand collide.
- Check out our free forex signals
- Follow the top economic events on FX Leaders economic calendar
- Trade better, discover more Forex Trading Strategies
- Open a FREE Trading Account
- Read our latest reviews on: Avatrade, Exness, HFM and XM