Forex Signals Brief Sept 10: US PPI Inflation Falls Pre-CPI, Man United Earnings After Hours
Gold returned to its highs, the dollar strengthened, and stocks continued to rise as traders positioned themselves ahead of U.S. PPI...
•
Last updated: Wednesday, September 10, 2025
Quick overview
- Markets showed caution ahead of U.S. producer price data, with gold prices retreating from record highs and the dollar regaining strength.
- Gold briefly reached a record high of $3,674 before closing lower at $1,622 due to profit-taking and revised labor market expectations.
- The U.S. dollar recovered after initial declines, supported by rising Treasury yields, while equities, particularly the Nasdaq, continued to extend gains.
- China's inflation data showed mixed signals, with expectations for a cooling Producer Price Index (PPI) that could influence Fed policy.
Gold returned to its highs, the dollar strengthened, and stocks continued to rise as traders positioned themselves ahead of U.S. producer price data on Tuesday, which posted a decent decline, causing markets to become cautious.
Gold (XAU/USD): Rally Stalls After Record Highs
Gold prices briefly broke into fresh record territory at $3,674 before retreating sharply and closing lower at $1,622. The move reflected a mix of profit-taking and recalibrated expectations around U.S. monetary policy after revised labor market data signaled slower employment growth. Despite Powell’s earlier warning at Jackson Hole about payroll revisions, the lack of a major Fed rate path adjustment weighed on bullion’s momentum.
U.S. Dollar and Yields: Recovery Amid Data Noise
The U.S. dollar initially slipped on the Bureau of Labor Statistics revision, which revealed job growth overstated by 911,000 through March—a 0.6% cut in overall employment. While consensus expectations had already prepared markets for a downward adjustment, the greenback only dipped briefly before recovering and advancing steadily. Rising Treasury yields added further support, signaling that traders see limited near-term chances of a 50 bps Fed cut despite the weaker jobs backdrop.
Equities: Nasdaq Extends Record Run
Wall Street closed on a positive note, with the Nasdaq reaching another record high as large-cap tech stocks drew late-session buying. The S&P 500 and Dow also advanced modestly, extending recent momentum, while the Russell 2000 lagged, reflecting ongoing concerns over smaller firms’ sensitivity to higher borrowing costs. Market sentiment remains anchored by expectations for eventual Fed easing but is now tied closely to inflation readings.
FX Market: Euro Under Pressure
The euro struggled, pressured by ongoing French political uncertainty, although it managed to outperform the Swiss franc. Broader FX action was subdued, with markets largely treading water ahead of inflation releases. Traders remain cautious on the euro’s trajectory as structural risks and political noise weigh on sentiment.
Key Market Events to Watch Today
China Inflation: Mixed Signs of Recovery
China’s July CPI printed flat year-on-year, improving from June’s -0.1% contraction. Core inflation, however, climbed to 0.8%, its highest level in 17 months. Analysts caution that headwinds—ranging from the persistent real estate slump to weak consumer confidence—continue to hold back any meaningful inflation rebound. August CPI is expected to slip back into negative territory at around -0.1% YoY, reinforcing a disinflationary trend despite targeted policy support.
US Producer Price Index (PPI) – August 2025
The August PPI report showed a softer-than-expected inflation print across both headline and core measures, with month-on-month prices even dipping into negative territory. The slowdown suggests easing producer-level cost pressures, which may support the Federal Reserve’s case for maintaining or even accelerating rate cuts.
However, sticky elements remain, as the broader ex-food, energy, and trade gauge held steady at 2.8% y/y, indicating underlying inflation persistence. Markets will likely weigh this moderation in PPI against upcoming CPI data to refine expectations for the Fed’s policy path.
- Headline PPI y/y: +2.6% vs +3.3% expected (prior +3.3%)
- Headline PPI m/m: -0.1% vs +0.3% expected (prior +0.9%)
- Core PPI (ex-food & energy) y/y: +2.8% vs +3.5% expected (prior +3.7%)
- Core PPI m/m: -0.1% vs +0.3% expected (prior +0.9%)
- PPI ex-food, energy & trade y/y: +2.8% vs +2.8% prior
- PPI ex-food, energy & trade m/m: +0.3% vs +0.6% prior
Earnings on Watch Today
- Manchester United (MANU)
-
Q4 2025 earnings report
-
Scheduled before market open (BMO)
-
Expected EPS: -0.07
- Lesaka Technologies (LSAK)
-
Q4 2025 earnings report
-
Scheduled after market close (AMC)
-
Expected EPS: 0.04
Last week, markets were quite volatile again, with gold soaring to $3,600. EUR/USD continued the upward move toward 1.17, while main indices closed higher. The moves weren’t too big though, and we opened 35 trading signals in total, finishing the week with 23 winning signals and 12 losing ones.
Gold Forms Reversing Candlestick After Reaching $3,674
Meanwhile, gold continues to attract strong safe-haven flows. Prices surged above $3,674 early yesterday, hitting a new record high, so buyers are in total control, while China has resumed buying bullion. Technical charts now highlight the $3,700 level as the next major resistance, which will be broken soon as the upside accelerates, however an upside-down daily candlestick is a bearish signal, which could indicate a deeper pullback after such a rally.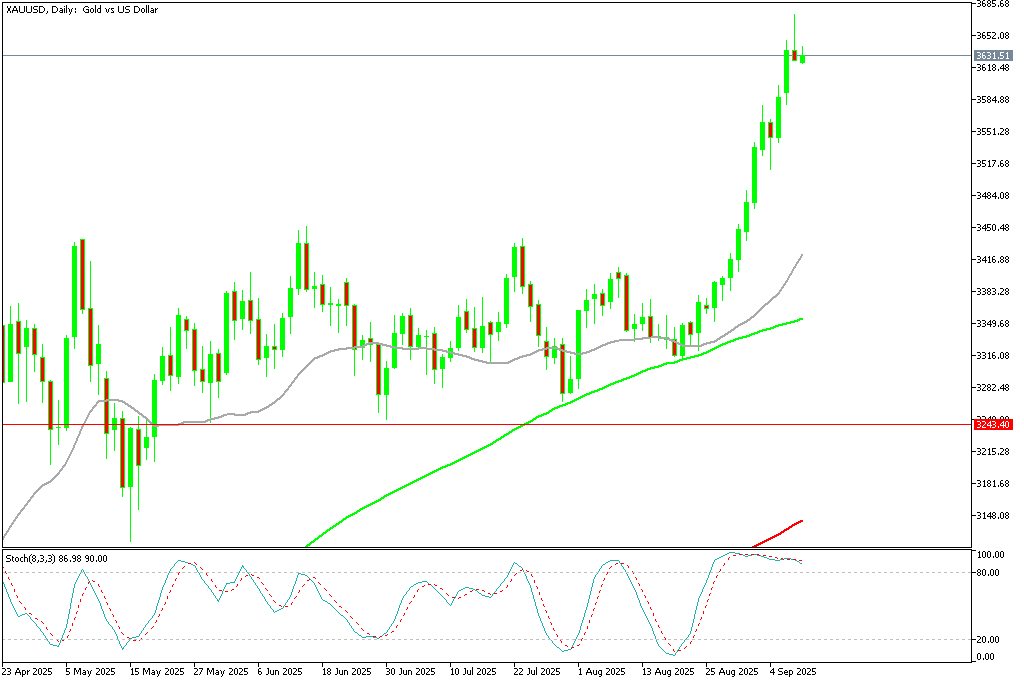
USD/JPY Continues Trading in the Range
Foreign exchange markets saw sharp swings. Early in the week, U.S. yield differentials and Japanese capital outflows pushed the dollar above ¥150, but disappointing U.S. jobs data triggered profit-taking, causing the USD/JPY to slide by four yen from its peak. The move underscored persistent volatility as traders weighed Japan’s intervention risks against evolving Fed expectations.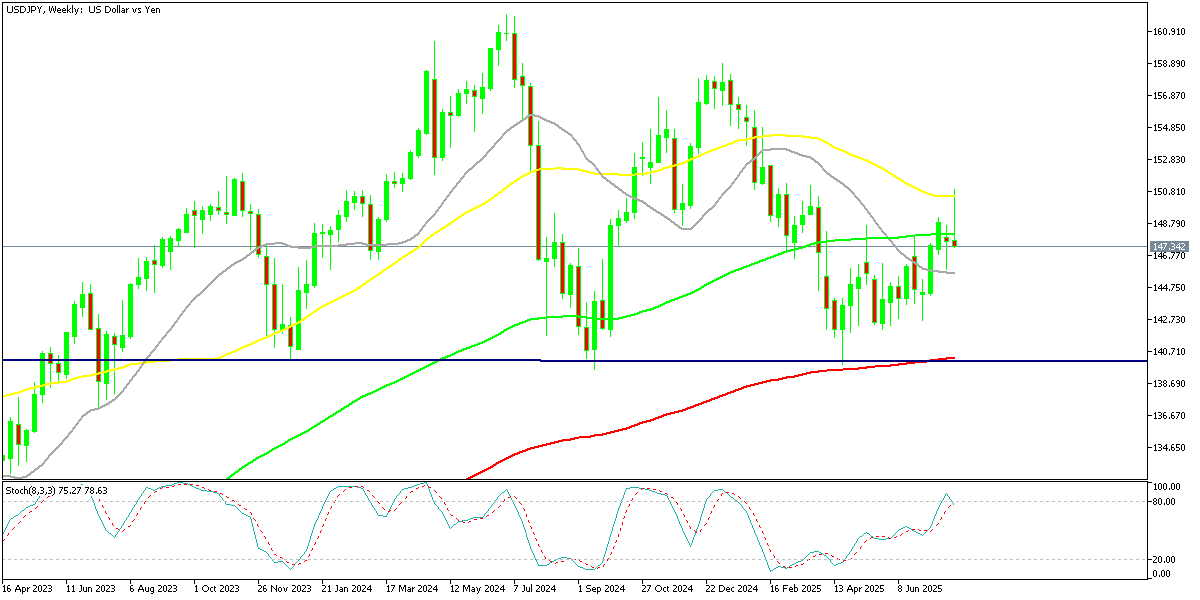
USD/JPY – Weekly Chart
Cryptocurrency Update
Bitcoin Climbs Above the $110K Level Again
Cryptocurrencies remained highly active over the summer. Bitcoin (BTC) climbed to fresh highs of $123,000 and $124,000 in July and August, supported by institutional inflows and technical strength. However, remarks from Treasury Secretary Scott Bessent ruling out U.S. increases to BTC reserves triggered a steep pullback, sending the coin down to $113,000 before recovering above $116,000 last week, however sellers returned and sent BTC below $110,000, however we saw a rebound off the 20 weekly SMA (gray) yesterday.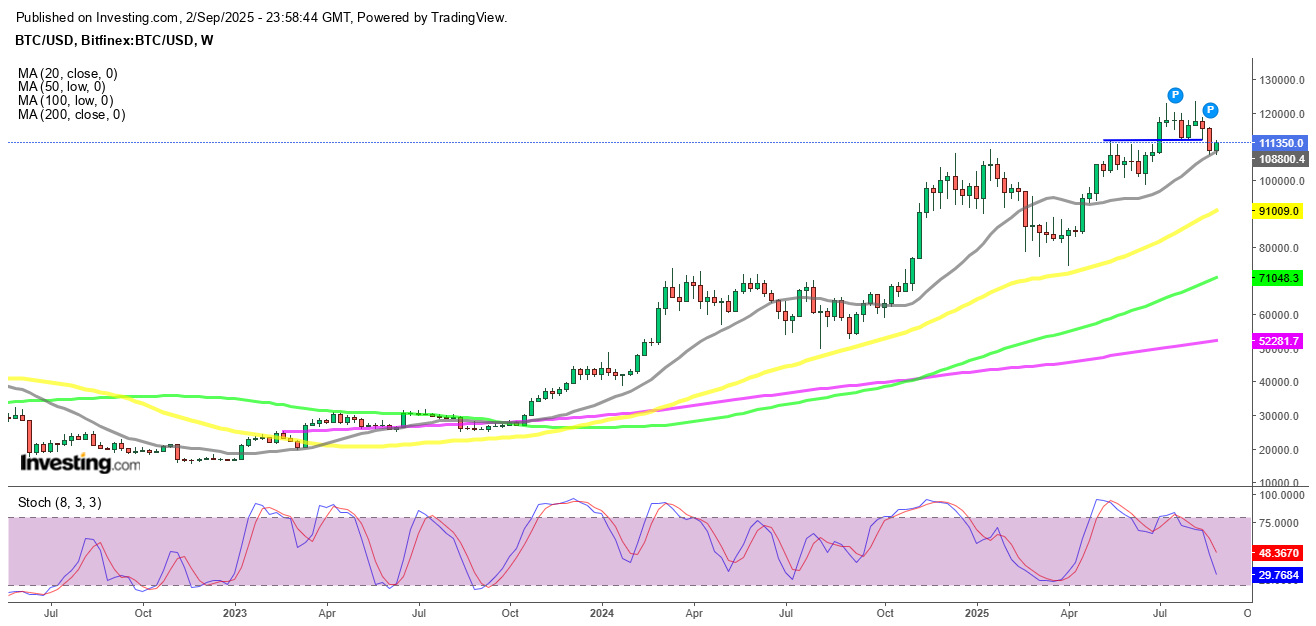
BTC/USD – Weekly chart
Ethereum Heads to $4,500
Ethereum (ETH) has been similarly strong, surging toward $4,800, its highest since 2021 and near its all-time peak of $4,860. Despite a dip last week, ETH found support at the 20-day SMA, with retail enthusiasm and renewed institutional participation driving fresh upside momentum. However buying resumed and on Sunday ETH/USD printed another record at $4,941. However we saw a retreat to $,000 lows over the weekend, but yesterday buyers returned.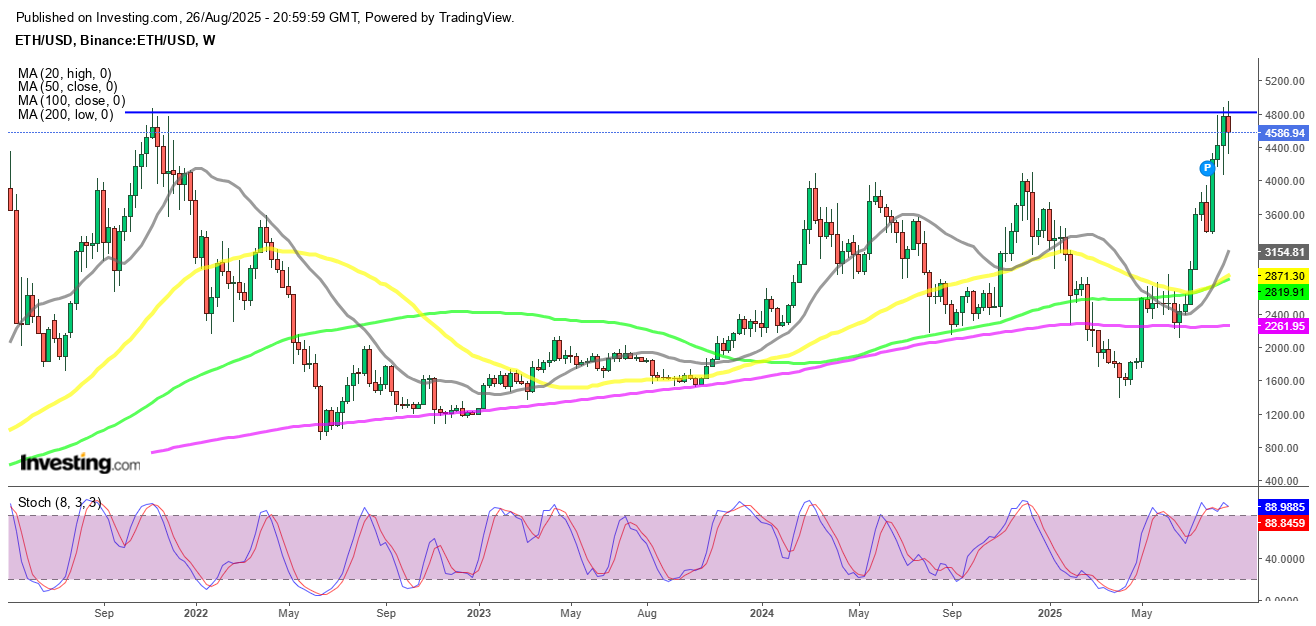
ETH/USD – Daily Chart
- Check out our free forex signals
- Follow the top economic events on FX Leaders economic calendar
- Trade better, discover more Forex Trading Strategies
- Open a FREE Trading Account
- Read our latest reviews on: Avatrade, Exness, HFM and XM
ABOUT THE AUTHOR
See More
Skerdian Meta
Lead Analyst
Skerdian Meta Lead Analyst.
Skerdian is a professional Forex trader and a market analyst. He has been actively engaged in market analysis for the past 11 years. Before becoming our head analyst, Skerdian served as a trader and market analyst in Saxo Bank's local branch, Aksioner. Skerdian specialized in experimenting with developing models and hands-on trading. Skerdian has a masters degree in finance and investment.
Related Articles


Sidebar rates
Related Posts
