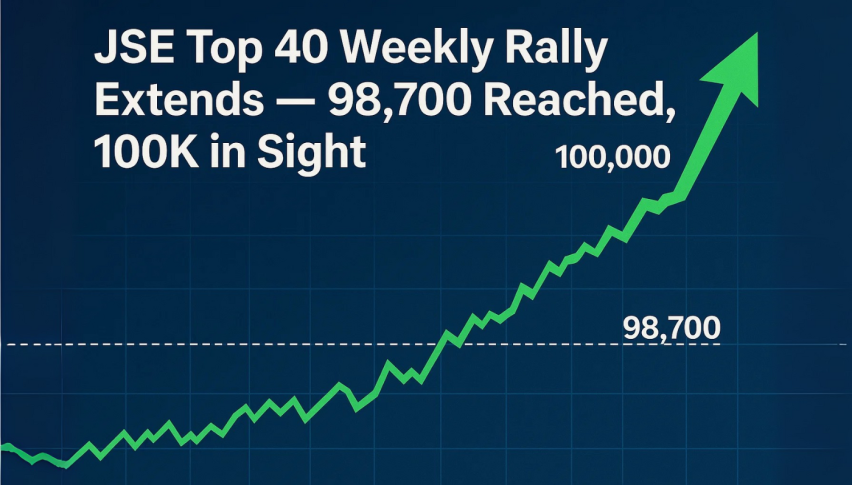
JSE Top 40 Weekly Rally Extends — 98,700 Reached, 100K in Sight
The JSE Top 40 Index closed the week higher again, pushing towards 98,700 and still inside its September trend channel. Large caps..
Quick overview
- The JSE Top 40 Index closed higher, approaching 98,700, while large caps continue to attract steady inflows despite mixed global sentiment.
- Bonds showed more conservative movement with the 2035 yield rising to 9.21%, but equities advanced as investors overlooked short-term risks.
- Technical indicators remain bullish, with the index supported by the 50 SMA at 97,800 and momentum indicators suggesting an upward bias.
- Key macroeconomic factors include stable interest rates from the South African Reserve Bank and upcoming economic indicators that could influence market sentiment.
The JSE Top 40 Index closed the week higher again, pushing towards 98,700 and still inside its September trend channel. Large caps are still attracting steady inflows, despite mixed global sentiment. Volumes were also solid, so investors are still comfortable holding risk in SA equities.
The bigger picture is cautiously optimistic. Bonds were more conservative, with the 2035 yield up to 9.21%, but equities went higher as investors ignored short term risks. The index has now extended its 52 week range to 70,516–98,714 and is moving towards uncharted territory near 100,000.
Key Levels This Week
From a technical perspective the Top 40 is still good. Price is in a rising channel and buyers are defending the lower end of the channel. The 50 SMA at 97,800 has acted as support and a recent pullback into this zone produced a strong rebound candle with a long lower wick – a classic sign of dip buying.
Momentum indicators are also bullish. The RSI is in the upper 50s to low 60s and not overbought. On the candlestick front no reversal patterns like shooting stars or three black crows have formed. The bias is to the upside as long as the channel holds.
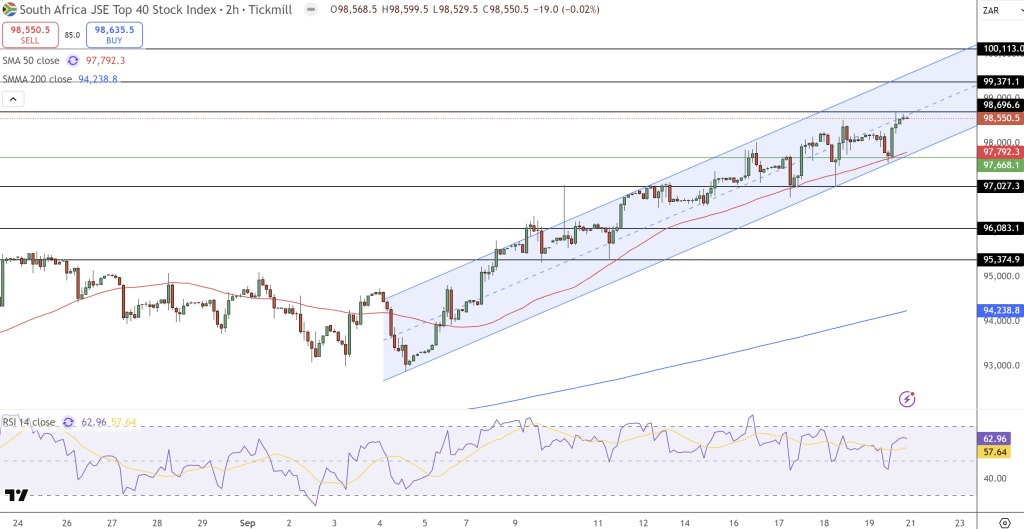
- Support zone: 97,668–97,800 (channel base + 50 SMA)
- Immediate resistance: 99,371
- Breakout target: 100,000 (psychological level)
A bullish engulfing or hammer candle at support would be a strong entry signal, while a break above 99,371 would confirm 100,000.
Macro Drivers This Week
The South African Reserve Bank left rates unchanged at 7.00% in September. This was a balance between slower inflation and monitoring earlier cuts. For equities stable rates are supportive in the short term, but any signs of persistent inflation will limit the enthusiasm.Two numbers to watch this week: business cycle leading indicator on Tuesday and producer price inflation on Thursday. Both will give us more information on the economy and cost pressures. And of course U.S.-SA trade tensions are still a risk, with tariffs on local exports set to impact manufacturing and employment.
- Check out our free forex signals
- Follow the top economic events on FX Leaders economic calendar
- Trade better, discover more Forex Trading Strategies
- Open a FREE Trading Account
- Read our latest reviews on: Avatrade, Exness, HFM and XM