Bitcoin Consolidates Under $115K, Critical $117,200 Resistance Determines Next Major Move
Bitcoin (BTC) remains range-bound between key support and resistance levels as traders await Federal Reserve data catalysts this week.
Quick overview
- Bitcoin is currently trading in a narrow range around $114,000, facing significant resistance at $117,200.
- Technical analysis indicates that the strength of the $117,200 resistance will determine Bitcoin's next price movement.
- Upcoming Federal Reserve data could trigger increased volatility in the Bitcoin market, with potential implications for future monetary policy.
- Two scenarios are emerging: a bullish breakout above $118,600 could lead to a surge towards $150,000, while a drop below $113,700 may see prices fall to $110,000.
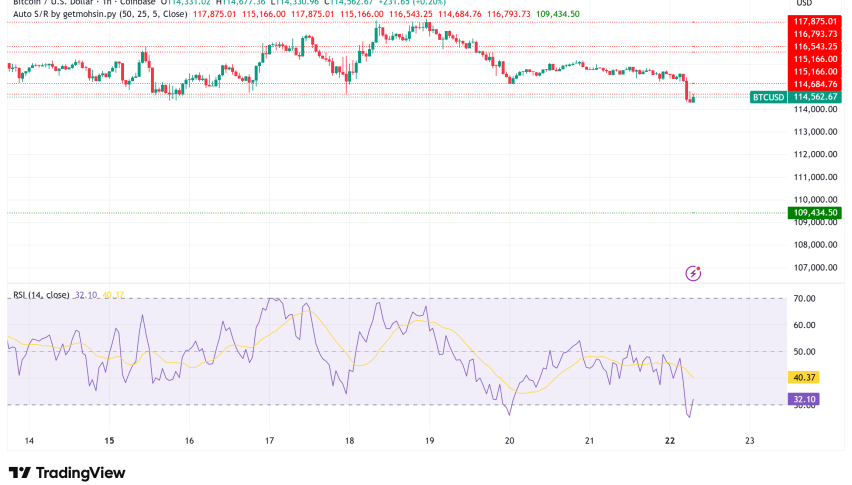
Bitcoin BTC/USD is still trading in a narrow range around $114,000. It has stayed quite stable over the previous 24 hours, even if there are tensions in the market. The biggest cryptocurrency in the world is stuck between important technical levels that could decide where it goes next.
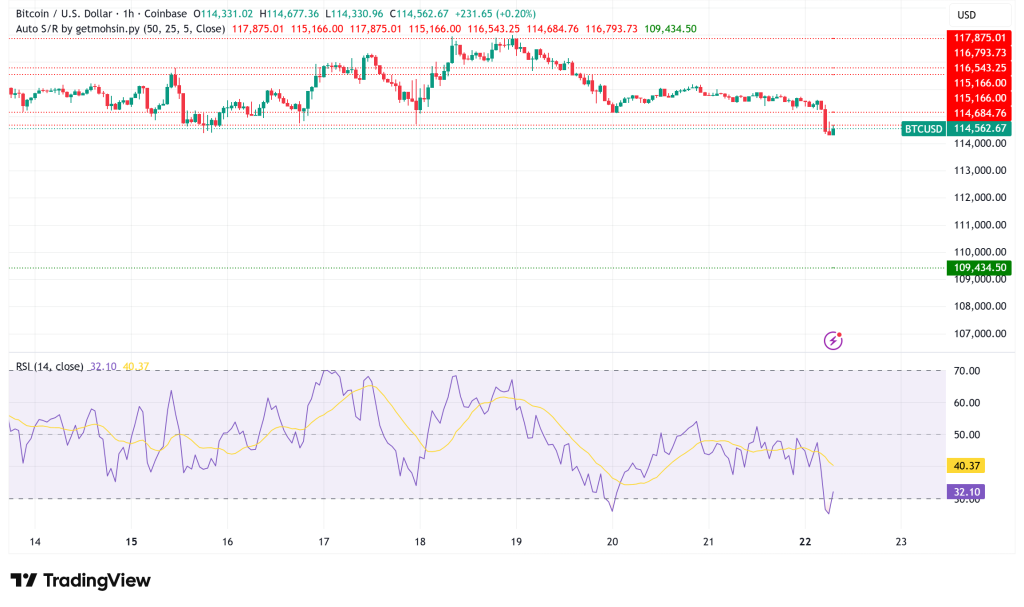
BTC/USD Technical Analysis: Pivotal Resistance at $117,200
The $117,200 resistance level has become the most important barrier keeping Bitcoin from reaching new all-time highs, according to top market analysts. Rekt Capital, a well-known trader, said that the retest of $114,000 support “continues to be successful,” but the resistance at about $117,200 makes a “range-bound construction” that traders are keeping a careful eye on.
The technical setup shows that Bitcoin is getting close to a turning point. The strength or weakness of the $117,200 resistance will probably determine whether the cryptocurrency can keep going up or have to take a break.
Bitcoin’s On-Chain Metrics Validate $117K as Key Inflection Point
Joao Wedson’s advanced on-chain research from Alphractal shows that the $117,000 pricing zone is quite important. Wedson correctly forecasted this level as a key resistance zone a week before using two advanced metrics: the CVDD (Cumulative Value Days Destroyed) Channel and the Fibonacci-Adjusted Market Mean Price.
The CVDD Channel, which keeps track of how capital moves in the market over time, met the Fibonacci-Adjusted Market Mean Price at exactly $117,000, making a statistically important resistance zone. This convergence is important from a technical point of view, but it also shows that the market is quite unsure about what to do while long-term holders think about their positions.
Federal Reserve Data Could Trigger Volatility Surge
This week, the macro environment is likely to cause a lot of volatility in the Bitcoin markets. The Federal Reserve’s favorite measure of inflation, the Personal Consumption Expenditures (PCE) index, will come out on September 26. This information comes just a few days after the Fed reduced interest rates for the first time in 2025.
Several officials from the Federal Reserve, including Chair Jerome Powell, are set to speak this week. Their comments could give us important information about future monetary policy. The CME Group’s FedWatch Tool says that markets are presently pricing in a very high chance of another 0.25% rate drop at the Fed’s meeting on October 29.
Bitcoin Price Prediction: Two Distinct Scenarios Emerge
Based on technical analysis and on-chain data, there are two main possibilities for how Bitcoin’s price may move in the near future:
- Bullish Scenario: Wedson’s analysis says that a definitive breakout over $118,600 would affirm stronger bullish momentum and “open the path for the next explosive move.” Some analysts still think that Bitcoin might reach $150,000 in the long term, and this breakthrough could help it get there.
- Bearish Scenario: If the price drops below the important $113,700 support level, it might quickly drop to $110,000. If the market corrects more, Bitcoin might drop back to the $100,000 level, which is a psychologically important level for many institutional investors who see it as a good place to buy.
Market Structure Suggests Imminent Resolution
The present trend of consolidation, which has seen four weekends in a row with low volatility, signals that a big move is coming. Trader Daan Crypto Trades said that the lack of CME Bitcoin futures gaps on weekends shows that there is less speculative activity, which is often a sign that volatility is about to rise.
Bitcoin is staying above important support levels, but it is meeting strong resistance. This suggests that the cryptocurrency market is in a holding pattern until something else happens. The combination of important technical levels and upcoming Federal Reserve data makes for a perfect storm that might cause prices to move quickly in either direction.
Bitcoin’s ability to break through the $117,200 resistance level could mean the start of its next big bull run phase, which could aim for the $150,000 level that many analysts think is still possible in the current market cycle. This is happening as more institutions adopt Bitcoin and the rules become clearer.
- Check out our free forex signals
- Follow the top economic events on FX Leaders economic calendar
- Trade better, discover more Forex Trading Strategies
- Open a FREE Trading Account
- Read our latest reviews on: Avatrade, Exness, HFM and XM
Related Articles


Sidebar rates
Related Posts
