GBP/USD Forecast: Pound Eyes $1.3560 as UK Borrowing Jumps to £18B
The Pound recovered some ground in early European trade, pushing GBP/USD up to 1.3465 after three days of losses...
Quick overview
- The Pound gained some ground in early European trade, with GBP/USD rising to 1.3465 after three days of losses.
- UK public borrowing surged to £18 billion, raising concerns about government debt if spending remains unchecked.
- The Bank of England held rates at 4.0%, citing a weaker labor market, while future moves are expected to be gradual and data dependent.
- Technical analysis shows GBP/USD stabilizing at 1.3450, with key support and resistance levels identified for traders.
The Pound recovered some ground in early European trade, pushing GBP/USD up to 1.3465 after three days of losses. However, this comes against a backdrop of fiscal headwinds.
UK public borrowing jumped to £18 billion, the highest for this month in five years and above forecasts of £12.8 billion. This unexpected increase will raise concerns about the government’s debt mountain if spending continues unchecked.
Market participants are watching Finance Minister Rachel Reeves closely. If she signals fiscal discipline is slipping, that could weigh on GBP/USD even more if debt risks escalate.
BoE Holds Rates but Outlook Unclear
Last week the Bank of England kept rates on hold at 4.0%. They cited a weaker labour market and growth concerns as the reason.
While that’s good for the Pound in the short term, the BoE said future moves will be gradual and data dependent. That’s limited the downside for the Pound but also leaves traders unsure, with the outlook cloudy over growth and inflation.
At the same time the Federal Reserve cut rates by 25bps but signalled a slower easing path than markets expected. Chair Jerome Powell described it as “risk management” which means the Fed isn’t rushing into dovish territory. Traders are now waiting for Fedspeak this week to see if the US Dollar will continue to strengthen.
GBP/USD Technical Outlook: Key Levels
The 2-hour chart shows price stabilising at 1.3450 just above 1.3442. Rejection wicks on recent candles suggest early buying interest but momentum is weak.
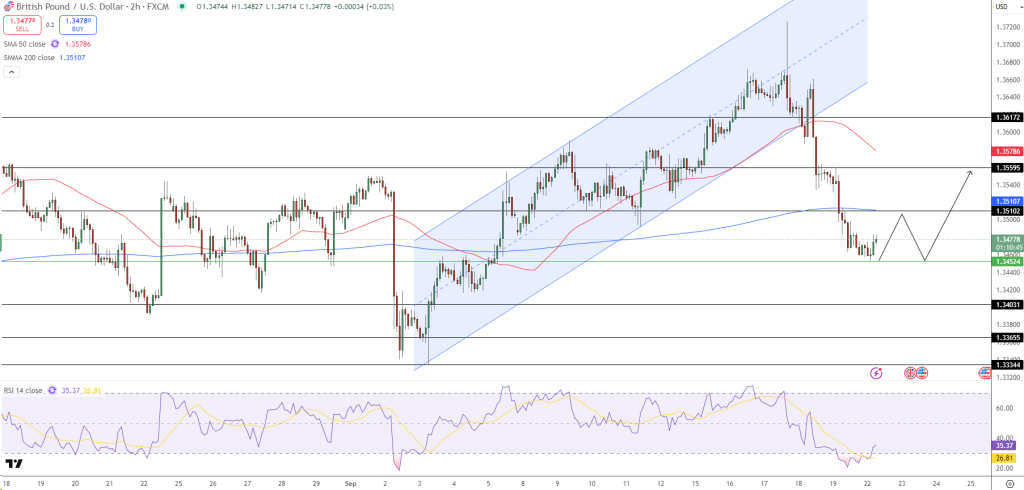
- Support levels: 1.3442, 1.3403, 1.3365
- Resistance levels: 1.3510 (200-EMA), 1.3560, 1.3617
- Indicators: RSI has bounced from 35, not yet confirming a bullish reversal.
If the bulls can clear 1.3510 the door opens to 1.3560 and 1.3617. Failure to hold 1.3440 however risks a move down to 1.3400.Trade: For newbies go long at 1.3450 with stops at 1.3400 and targets at 1.3510 and 1.3560. More conservative traders wait for a break above the 200-EMA to confirm the move. If 1.3440 breaks, bearish at 1.3365.
- Check out our free forex signals
- Follow the top economic events on FX Leaders economic calendar
- Trade better, discover more Forex Trading Strategies
- Open a FREE Trading Account
- Read our latest reviews on: Avatrade, Exness, HFM and XM