Bitcoin Price Prediction: ETFs Lose $902M as BTC Eyes $116K Breakout
US Bitcoin ETFs saw $902.5 million in outflows between September 22-26, ending a 4 week inflow streak, according to SoSoValue...

Quick overview
- US Bitcoin ETFs experienced $902.5 million in outflows from September 22-26, ending a four-week inflow streak due to investor caution.
- Fidelity's FBTC led the outflows with $737.8 million, while BlackRock's IBIT saw $173.8 million in inflows, bucking the trend.
- Ethereum ETFs also faced challenges, with $795.6 million in outflows, despite Bitcoin ETFs seeing a total of $2.57 billion in inflows for September.
- Bitcoin is currently trading at $112,074, testing key resistance levels, with potential upside if it closes above $112,600.
US Bitcoin ETFs saw $902.5 million in outflows between September 22-26, ending a 4 week inflow streak, according to SoSoValue. Investor caution due to US political gridlock and Fed uncertainty.
Fidelity’s FBTC led with $737.8 million in outflows. ARK 21Shares’ ARKB saw $123.3 million, Bitwise’s BITB $92.4 million. Smaller funds like Grayscale’s GBTC, VanEck’s HODL and Franklin Templeton’s EZBC lost $127.9 million combined.
BlackRock’s IBIT bucked the trend with $173.8 million in inflows, Invesco’s BTCO added $10 million. Ethereum ETFs also struggled with $795.6 million in outflows, ending a 2 week inflow run.
Fed Caution and Trump Tariffs
Despite September’s volatility, Bitcoin ETFs still saw $2.57 billion in inflows vs $751 million in August outflows. But short term sentiment has cooled due to:
- Fed officials, led by Jerome Powell, signaling no rate cuts.
- Trump’s tariff package on pharmaceuticals, trucks and furniture, reigniting trade war concerns.
Together these factors have dented risk appetite and hurt crypto and equities.
Bitcoin Price Prediction: Key Levels
Bitcoin (BTC/USD) is bouncing back after September’s correction and is trading at $112,074 and has broken out of the descending channel. The breakout was triggered by a “three white soldiers” candlestick pattern, a reversal signal.
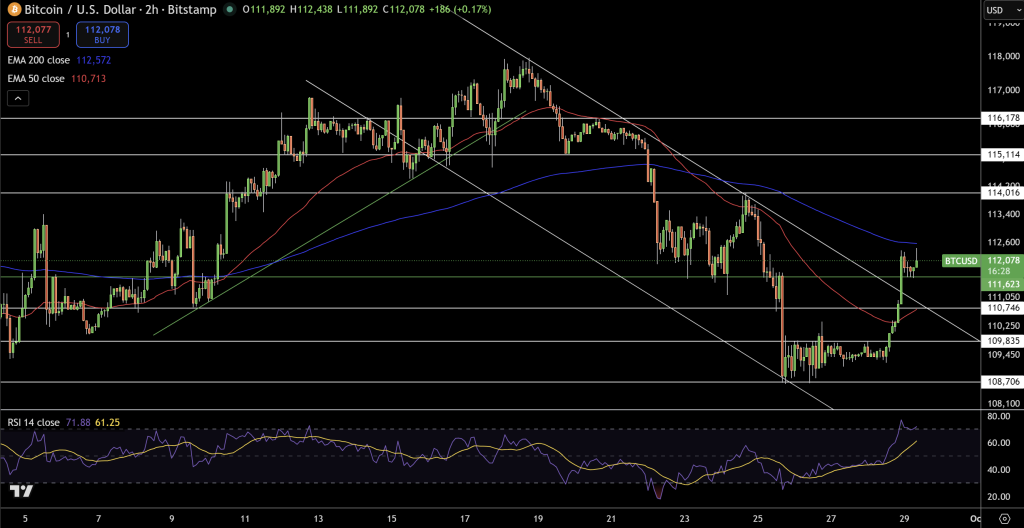
BTC has cleared the 50-EMA ($110,713) and is now testing the 200-EMA ($112,572) — a level that often determines bullish or bearish control.
- Upside: Close above $112,600 could lead to $114,000 and $116,200.
- Downside: Failure to hold $112,000 could lead to $111,000-$111,050 support.
- Momentum: RSI at 71 is strong buying pressure but warns of overbought.
- Trade: Buy above $112,600, stop below $111,000, target $114,000-$116,200. For now, it’s make or break.
- Check out our free forex signals
- Follow the top economic events on FX Leaders economic calendar
- Trade better, discover more Forex Trading Strategies
- Open a FREE Trading Account
- Read our latest reviews on: Avatrade, Exness, HFM and XM
Related Articles

Sidebar rates
Related Posts
