Amazon (AMZN) Stock Forecast: Is the Rally Still Intact After Recent Resistance Test?

Quick overview
- Amazon stock (AMZN) has rallied nearly 48% over seven months but has recently entered a corrective phase.
- The stock is currently testing the 0.382 Fibonacci support at $210, with potential for a deeper retracement if this level fails.
- Mixed technical signals are present, with long-term indicators remaining bullish while short-term momentum shows signs of weakness.
- Key resistance levels are at $225 and between $234 and $242.5, which need to be broken for a continuation of the uptrend.
Amazon stock (AMZN) has staged an impressive seven-month rally, climbing nearly 48% and coming close to retesting its all-time high at $242.5. However, over the past three months, the stock has entered a corrective phase, retracing part of those gains. The key question now is — will Amazon soon resume its upward trajectory, or is a deeper correction ahead?
Amazon Stock (AMZN) Retraces to the 0.382 Fibonacci Support
After a strong 48% rally within four months, Amazon (AMZN) entered a correction phase roughly three months ago, following a bearish rejection near the previous high between $234 and $242.5. The stock has since retraced to the 0.382 Fibonacci support at $210, where it initially bounced off bullishly, attempting another retest of the resistance zone between $234 and $242.5. However, it failed to break above this critical resistance, suggesting that another retest of the $210 support could now be underway.
Should the 0.382 Fib support at $210 fail to hold, AMZN may extend its correction toward the golden ratio support around $190. Despite this short-term weakness, the MACD lines remain bullishly crossed, supporting the long-term bullish structure, while the RSI hovers in neutral territory. That said, the MACD histogram has begun ticking bearishly lower this month, hinting at waning momentum and a possible deeper retracement ahead.

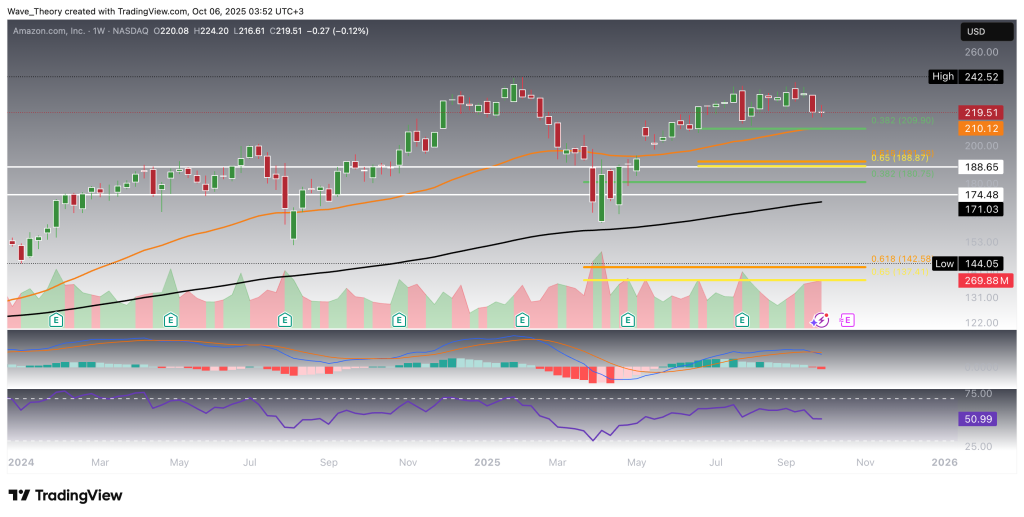
Weekly Indicators Present Mixed Signals for Amazon Stock (AMZN)
On the weekly chart, Amazon (AMZN) presents mixed technical signals. The EMAs remain in a golden crossover, confirming the mid-term trend as bullish. However, momentum has started to fade — the MACD lines have now crossed bearishly, and the MACD histogram continues to tick lower, suggesting a loss of bullish strength.
Meanwhile, the RSI stays within neutral territory, providing no clear directional bias at this stage. From a structural standpoint, AMZN appears to be retracing toward the 0.382 Fibonacci support at $210, where the 50-week EMA offers additional confluence as a key support zone. A sustained bounce from this level could reaffirm the broader uptrend, while a decisive breakdown below it might open the path toward deeper Fibonacci retracements.
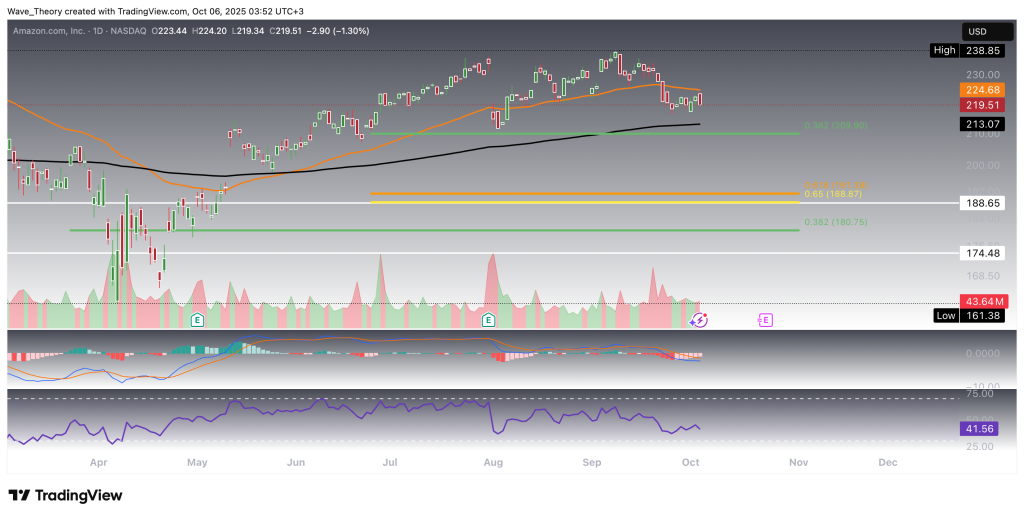
Rather Bullish Signals on the Amazon (AMZN) Daily Chart
On the daily chart, Amazon (AMZN) continues to exhibit overall bullish momentum, despite short-term fluctuations. The MACD histogram maintains a strong upward trajectory, while the EMAs remain in a golden crossover, confirming the trend bullishly in the short- to medium term.
On the other hand, the MACD lines have recently crossed bearishly, hinting at temporary consolidation, and the RSI stays neutral, providing no immediate directional cues.
Most recently, AMZN faced rejection at the 50-day EMA resistance around $225 and now appears to be retracing toward the 0.382 Fibonacci support at $210, where the 200-day EMA offers additional support confluence. A bullish rebound from this level could reignite momentum toward the previous resistance zone near $234–$242.
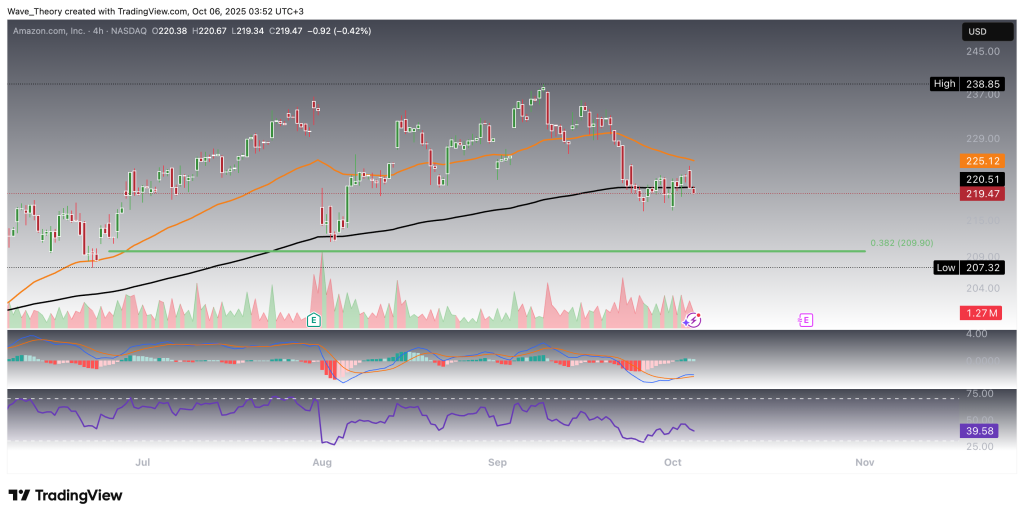
Similar Outlook on the 4H Chart
On the 4-hour chart, Amazon (AMZN) maintains a generally bullish structure. The EMAs have formed a golden crossover, confirming the uptrend in the short term. Additionally, the MACD lines remain bullishly crossed, signaling continued upward momentum, while the RSI hovers in neutral territory, showing no signs of exhaustion yet.
However, the MACD histogram has recently started to tick bearishly lower, indicating that a short-term correction could be underway. Should AMZN lose its current support at the 200-4H EMA around $220.5, the stock could retrace toward the 0.382 Fibonacci support at $210, where buyers may step back in to defend the trend.
Amazon (AMZN) Stock – Technical Summary & Key Levels
Amazon stock has shown a strong bullish performance this year, rallying nearly 48% before facing resistance near its all-time-high zone between $234 and $242.5. After multiple rejections at this level, AMZN entered a correction phase.
Currently, $210 serves as a critical 0.382 Fibonacci support, reinforced by the 50-week and 200-day EMAs. A break below this level could trigger a deeper pullback toward the golden ratio support at $190.
On the upside, resistance remains at $225 (50-day EMA), followed by $234–$242.5, which must be broken to confirm a continuation of the broader uptrend.
While long-term indicators remain bullish, the MACD histogram and RSI suggest short-term weakness and potential consolidation before the next move.
Key Levels:
-
Support: $210 → $190
-
Resistance: $225 → $234–$242.5
-
Trend: Bullish in long-term, consolidating short-term
- Check out our free forex signals
- Follow the top economic events on FX Leaders economic calendar
- Trade better, discover more Forex Trading Strategies
- Open a FREE Trading Account
- Read our latest reviews on: Avatrade, Exness, HFM and XM
Related Articles


Sidebar rates
Related Posts
