btc-usd
Forex Signals October 6: Government Shutdown Freezes NFP, Yet Stocks and Bitcoin Hold Strong
Markets navigated the third week of the U.S. government shutdown with surprising resilience, even as key economic data releases—including...
•
Last updated: Monday, October 6, 2025
Quick overview
- Markets showed resilience during the third week of the U.S. government shutdown, despite delays in key economic data releases.
- The U.S. Non-Farm Payrolls report was postponed, while ADP data indicated a decline in September jobs, suggesting potential labor market softness.
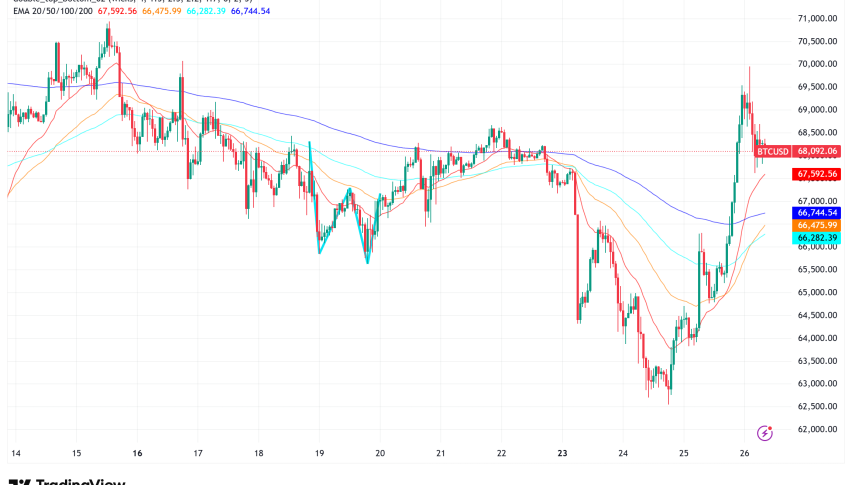
- Bitcoin surged to $123,966, nearing its all-time high, supported by lower bond yields and safe-haven flows amid the shutdown.
- U.S. equities advanced for the week, with all major indices posting gains, particularly in the healthcare sector.
Live BTC/USD Chart
BTC/USD

0.0000
MARKETS TREND
Markets navigated the third week of the U.S. government shutdown with surprising resilience, even as key economic data releases—including the jobs report—were delayed.
Jobs Data Postponed Amid Mixed Service Sector Reports
The closely watched U.S. Non-Farm Payrolls (NFP) report—originally scheduled for last Friday—was delayed until next week at the earliest due to the government shutdown. However, the ADP private payroll data, released midweek, offered an early glimpse into the labor market and showed a decline in September jobs, signaling potential softness ahead of the official NFP release.
Meanwhile, key U.S. service-sector indicators painted a mixed picture. The final reading for the S&P Global Services PMI in September came in at 54.2, slightly higher than the preliminary 53.9 but still a touch below August’s 54.5. By contrast, the ISM U.S. Services PMI disappointed, sliding to 50.0—well under expectations of 51.7 and down from 52.0 in August. Business activity contracted to 49.9, new orders fell sharply to 50.4 from 56.0, and employment weakened further to 47.2, marking its fourth consecutive month of contraction.
Bitcoin Approaches Record Highs
Cryptocurrencies rallied as Bitcoin surged to $123,966, coming within reach of its all-time high of $124,517 set in August. The rally was supported by lower bond yields, a stronger equity market, and safe-haven flows tied to concerns over the ongoing U.S. government shutdown, which encouraged some investors to shift away from traditional currencies.
Crude Oil Slips on OPEC Output Decision
Energy markets faced headwinds as crude oil futures declined throughout the week, pressured further by OPEC’s decision over the weekend to increase production levels. The move added downward pressure to already softening oil prices.
Stocks End Week Higher Despite Headwinds
U.S. equities showed resilience despite the political uncertainty in Washington. All major indices advanced for the week:
- Dow Jones: +1.10%
- S&P 500: +1.09%
- NASDAQ: +1.32%
- Russell 2000: +1.72%
Among sectors, healthcare outperformed, posting its best weekly performance since June 2022, driven by robust earnings and strong investor demand for defensive growth plays.
Key Events to Watch This Week
This week’s calendar is packed with policy updates, trade figures, and key inflation prints that could influence sentiment across equities, bonds, and currencies.
Particular attention will be on central bank signals (RBNZ, NBP, ECB, FOMC minutes) and U.S. labor market data, which may shape expectations for future interest-rate paths. The combination of inflation updates from Europe and Asia alongside trade figures will provide crucial insights into the global growth outlook for Q4.
Monday
- Eurozone Construction PMI (September)
- Eurozone Sentix Investor Confidence (October)
- U.S. Employment Trends (September)
- New Zealand NZIER Business Confidence (Q3)
Tuesday
- EIA Short-Term Energy Outlook (STEO)
- German Industrial Orders (August)
- U.S. International Trade Balance (August)
- Canadian Trade Balance (August)
- Canadian Ivey PMI (September)
- Chinese Foreign Exchange Reserves (September)
Wednesday
- RBNZ Policy Announcement
- U.S. FOMC Minutes (September)
- Remarks from BoJ Governor Ueda
Thursday
- ECB Meeting Minutes (September)
- Eurogroup Meeting
- U.S. Weekly Unemployment Claims (TBC)
Friday
- Canadian Employment Report (September)
- U.S. University of Michigan Consumer Sentiment Prelim. (October)
- Chinese M2 Money Supply / New Yuan Loans (September)
Last week, markets were quite volatile again, with gold soaring to $3,6065. EUR/USD continued the pullback move toward 1.1450, while main indices closed higher again. The moves weren’t too big though, and we opened 35 trading signals in total, finishing the week with 23 winning signals and 12 losing ones.
Gold Stays Close to $4,000
Although demand for safe haven assets is still high, gold fell precipitously from record highs following the Fed’s most recent rate decrease as profit-taking was prompted by Powell’s cautious tone. Earlier this week, gold jumped beyond $3,700 and reached $3,707.42 following the Federal Reserve’s announcement of a 25 basis point rate decrease to 4.25%. But the impetus soon waned, and prices dropped back to $3,627, a $80 decline from the new all-time high. As traders locked in profits after the rally driven by dovish predictions, there was a sudden fall but buyers returned on Friday pushing the price $60 higher. Yesterday buyers continued to push and XAU reached another record high at $3,896.52 but retreated lower later to slip below $3,820, although buyers came back and we saw a rebound late in the US session.
USD/JPY Continues to Bounce Between 2 MAs
Foreign exchange markets saw sharp swings. Early in the week, U.S. yield differentials and Japanese capital outflows pushed the dollar above ¥150, but disappointing U.S. jobs data triggered profit-taking, causing the USD/JPY to slide by four yen from its peak. The move underscored persistent volatility as traders weighed Japan’s intervention risks against evolving Fed expectations.
USD/JPY – Weekly Chart
Cryptocurrency Update
Bitcoin Reclaims the $120K Level Again
Cryptocurrencies remained highly active over the summer. Bitcoin (BTC) climbed to fresh highs of $123,000 and $124,000 in July and August, supported by institutional inflows and technical strength. However, remarks from Treasury Secretary Scott Bessent ruling out U.S. increases to BTC reserves triggered a steep pullback, sending the coin down to $113,000 before recovering above $116,000 last week, however sellers returned and sent BTC below $110,000, breaking the 20 weekly SMA (gray) as well but we have seen a strong rebound this week, sending the price above $120K.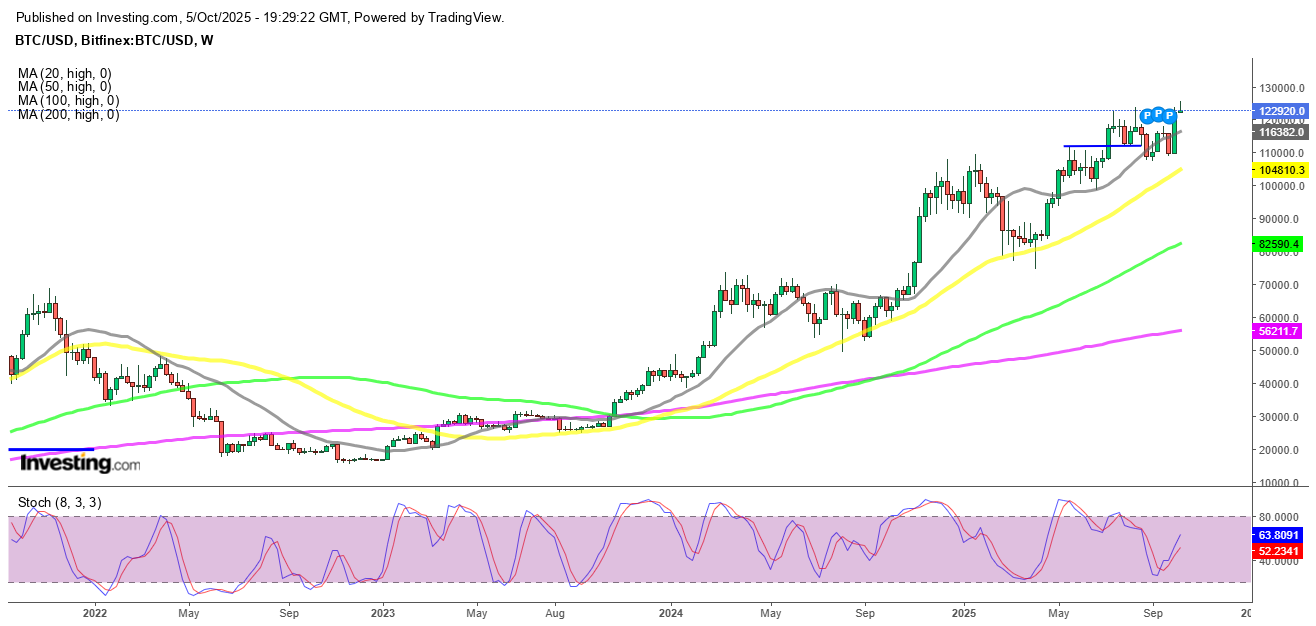
BTC/USD – Weekly chart
Ethereum Heads for $4,500
Ethereum (ETH) has been similarly strong, surging toward $4,800, its highest since 2021 and near its all-time peak of $4,860. Despite a dip last week, ETH found support at the 20-day SMA, with retail enthusiasm and renewed institutional participation driving fresh upside momentum. However buying resumed and on Sunday ETH/USD printed another record at $4,941 but we saw a retreat which sent ETH below $4,000. Yet buyers are back and now ETH is heading for $4,500.
ETH/USD – Weekly Chart
- Check out our free forex signals
- Follow the top economic events on FX Leaders economic calendar
- Trade better, discover more Forex Trading Strategies
- Open a FREE Trading Account
- Read our latest reviews on: Avatrade, Exness, HFM and XM
ABOUT THE AUTHOR
See More
Skerdian Meta
Lead Analyst
Skerdian Meta Lead Analyst.
Skerdian is a professional Forex trader and a market analyst. He has been actively engaged in market analysis for the past 11 years. Before becoming our head analyst, Skerdian served as a trader and market analyst in Saxo Bank's local branch, Aksioner. Skerdian specialized in experimenting with developing models and hands-on trading. Skerdian has a masters degree in finance and investment.