Rolls Royce Stock (RR) Jumps 3,344% in Five Years: Here’s What Investors Need to Know

Quick overview
- Rolls-Royce stock has surged over 3,344% in the past five years, with significant growth in the last two years.
- The stock recently reached an all-time high of £1,196, supported by a bullish technical backdrop, including a golden crossover in EMAs.
- However, caution is advised as momentum indicators show signs of weakening, with potential support levels at £1,103.6 and £861.
- Traders should closely monitor key support levels and momentum indicators for signs of consolidation or corrective pressure.
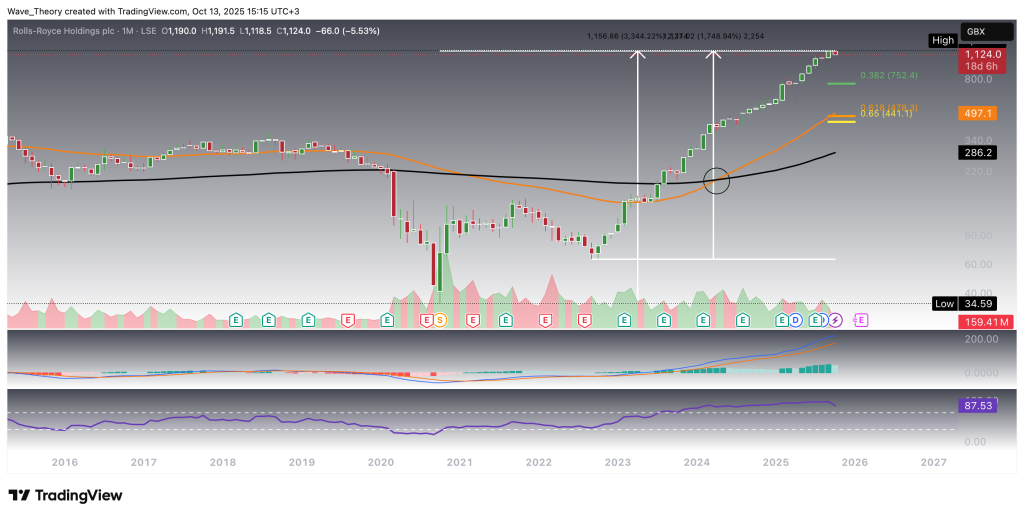
Over the past five years, Rolls-Royce stock (RR) has delivered an extraordinary surge of more than 3,344%, with roughly 1,750% of that growth occurring in just the last two years. As the company continues to capture investor attention, the pressing question remains: can Rolls-Royce sustain this remarkable upward trajectory?
Golden Crossover Emerges on Monthly Chart of Rolls-Royce (RR) Stock
Rolls-Royce stock has recently achieved a remarkable milestone, reaching an all-time high of £1,196 last month. On the monthly chart, the technical backdrop remains strongly bullish: the MACD lines are positively crossed, and the EMAs have formed a golden crossover, confirming the long-term uptrend.
However, caution is warranted in the near term. The RSI has entered overbought territory, and the MACD histogram has begun to tick lower this month, signaling a potential slowdown in momentum despite the underlying bullish trend. Traders and investors should monitor these indicators closely for signs of consolidation or corrective pressure.
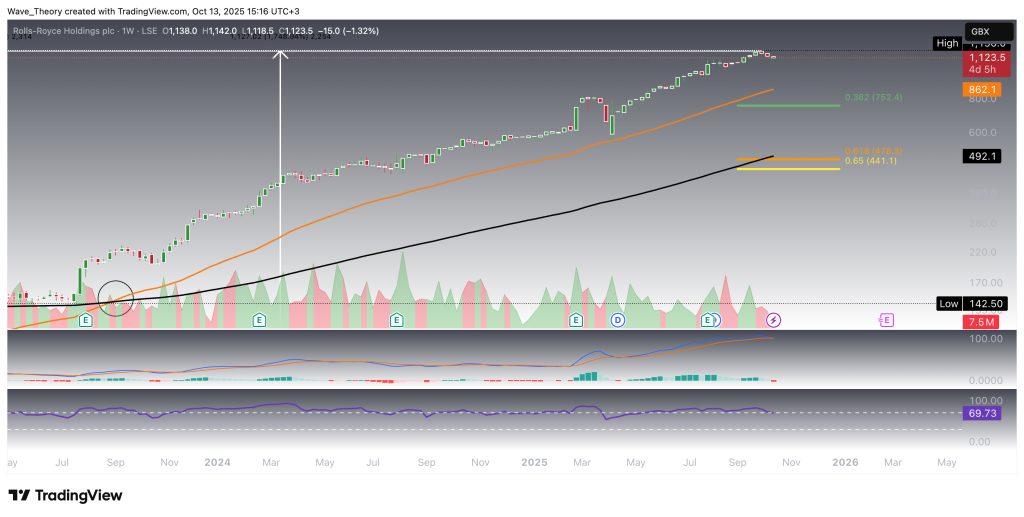
Will Rolls-Royce (RR) Stock Test Key Fibonacci Support Levels?
On the weekly chart, Rolls-Royce has shown a downward drift over the past three weeks. The MACD lines are approaching a bearish cross, with the MACD histogram continuing to tick lower, indicating weakening momentum. Meanwhile, the RSI has retreated to neutral territory, while the EMAs maintain a golden crossover, signaling that the mid-term trend remains structurally bullish.
In the near term, RR could extend its corrective phase toward the 50-week EMA at £861. Should this level fail to hold, the stock could test its next key Fibonacci supports at £752.4 and £450, with the 50-week EMA at £492 providing additional support along the way. Traders should monitor these levels closely for potential buying opportunities or trend confirmation.
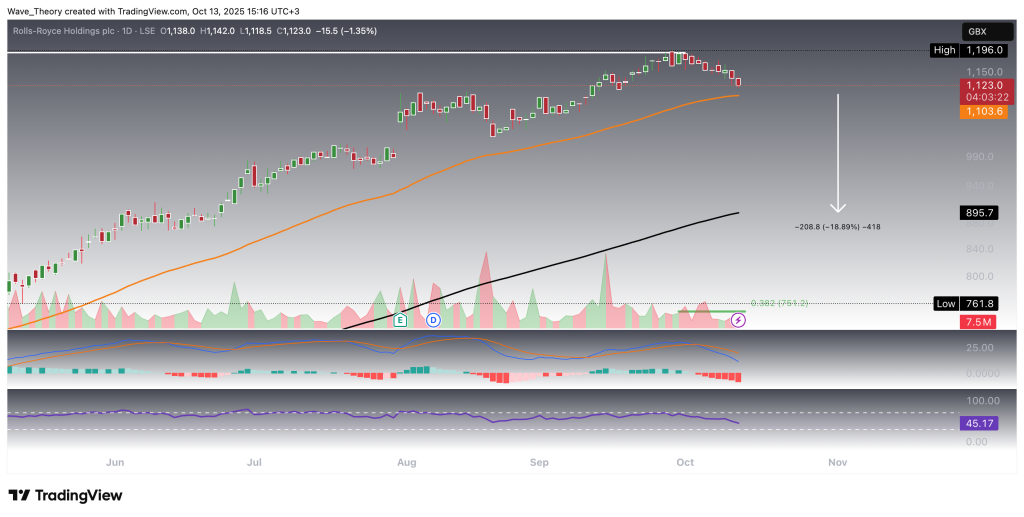
Immediate Support Identified at 50-Day EMA for Rolls-Royce (RR)
On the daily chart, Rolls-Royce continues to show a golden crossover in its EMAs, reinforcing a short- to medium-term bullish trend. However, momentum indicators are signaling caution: the MACD lines are bearishly crossed and the MACD histogram is trending lower, while the RSI remains in neutral territory.
Currently, RR finds immediate support at the 50-day EMA around £1,103.6. Should this level fail, the next major support resides at the 200-day EMA at £895.7, implying a potential downside of approximately 19%. Traders should monitor price action closely around these technical inflection points for signs of either a rebound or further correction.
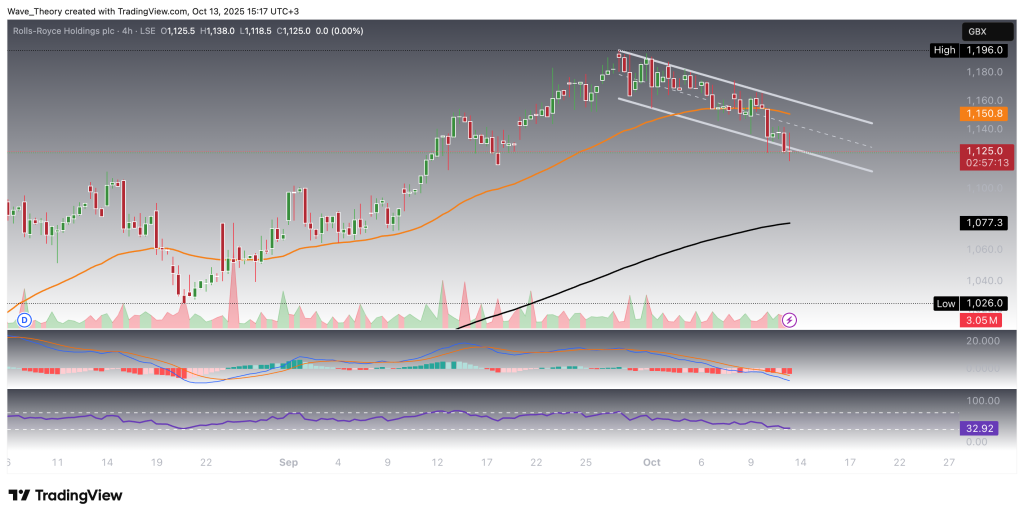
Rolls-Royce (RR) Stock Navigates Short-Term Downward Channel
In the short term, Rolls-Royce is trading within a downward channel, having recently broken the 50-4H EMA support at £1,150.8. Despite this, the EMAs maintain a golden crossover, confirming an underlying bullish trend.
Momentum indicators, however, signal caution: the MACD lines have crossed bearishly, the MACD histogram continues lower, and the RSI has moved into oversold territory, suggesting that the stock may be approaching a short-term rebound or consolidation phase within the channel.
Rolls-Royce (RR) Technical Summary – Key Levels
Short-Term (4H Chart):
-
Immediate support broken: 50-4H EMA at £1,150.8
-
Indicators: MACD bearishly crossed, MACD histogram ticking lower, RSI oversold
Daily Chart:
-
Immediate support: 50-day EMA at £1,103.6
-
Next major support: 200-day EMA at £895.7 (~19% downside)
-
EMAs: Golden crossover (bullish), MACD histogram bearish, RSI neutral
Weekly Chart:
-
Key support: 50-week EMA at £861
-
Fibonacci support levels: £752.4 and £450
-
Additional 50-week EMA support: £492
-
EMAs: Golden crossover (mid-term bullish), MACD lines near bearish cross, RSI neutral
Monthly Chart:
-
All-time high: £1,196
-
EMAs: Golden crossover confirms long-term bullish trend
-
MACD lines bullishly crossed, histogram ticking lower, RSI overbought
Summary:
Rolls-Royce remains structurally bullish across all timeframes, but short- to mid-term momentum shows signs of weakening. Key support levels to watch are £1,150.8 (4H), £1,103.6 (daily), £861 (weekly), and £752–£450 (weekly Fibonacci). On the upside, breaking short-term resistance could sustain the long-term bullish trajectory toward or beyond the all-time high of £1,196.
- Check out our free forex signals
- Follow the top economic events on FX Leaders economic calendar
- Trade better, discover more Forex Trading Strategies
- Open a FREE Trading Account
- Read our latest reviews on: Avatrade, Exness, HFM and XM