Tesla Stock Surges 44.6% Amid Market Rebound

Quick overview
- Tesla Inc. (TSLA) has surged approximately 44.6% since last month, raising questions about its ability to reclaim its all-time high of $488.5.
- The stock has demonstrated a classic Fibonacci support and resistance pattern, with bullish confirmations from multiple technical indicators.
- Currently, TSLA is facing resistance near its all-time high and is consolidating 12% below that level, with critical support zones identified between $382 and $395.
- The overall bullish trend remains intact as long as key support levels hold, with potential for further upside if the stock breaks above its all-time high.
Tesla Inc. (NASDAQ: TSLA) has experienced a powerful rally, climbing approximately 44.6% since last month. With momentum surging, investors are now asking: can Tesla maintain this upward trajectory and reclaim its all-time high of $488.5?
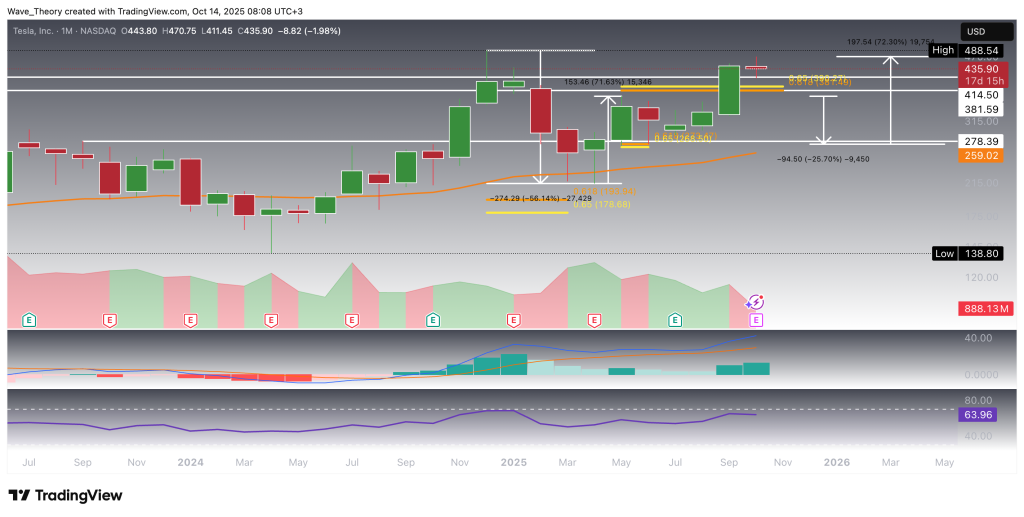
Tesla (TSLA) Stock Follows Classic Fibonacci Playbook
During the transition from 2024 to 2025, Tesla (TSLA) experienced a significant correction, declining approximately 56% from its all-time high of $488.5 down to the golden ratio support at $194. At this level, the stock staged a bullish rebound, climbing roughly 72% before encountering resistance at the golden ratio level of $380, where it faced a temporary bearish rejection.
Subsequently, TSLA retraced about 26% to the next golden ratio support at $270 within a month, before bouncing off bullishly again and embarking on a three-month upward movement.
Most recently, TSLA has surged over 72%, successfully breaking through the key golden ratio resistance at $380, thereby invalidating the previous correction phase and confirming the continuation of the long-term uptrend.
Technical Indicators:
-
MACD histogram has started to tick bullishly higher since last month, signaling renewed buying momentum.
-
MACD lines remain bullishly crossed, reinforcing the uptrend.
-
RSI is in neutral territory, indicating that the stock has room to move higher before overbought conditions emerge.
TSLA’s price action demonstrates textbook Fibonacci-based support and resistance play, with bullish confirmations across multiple technical indicators, suggesting the stock remains in a strong uptrend in both the short- and mid-term.
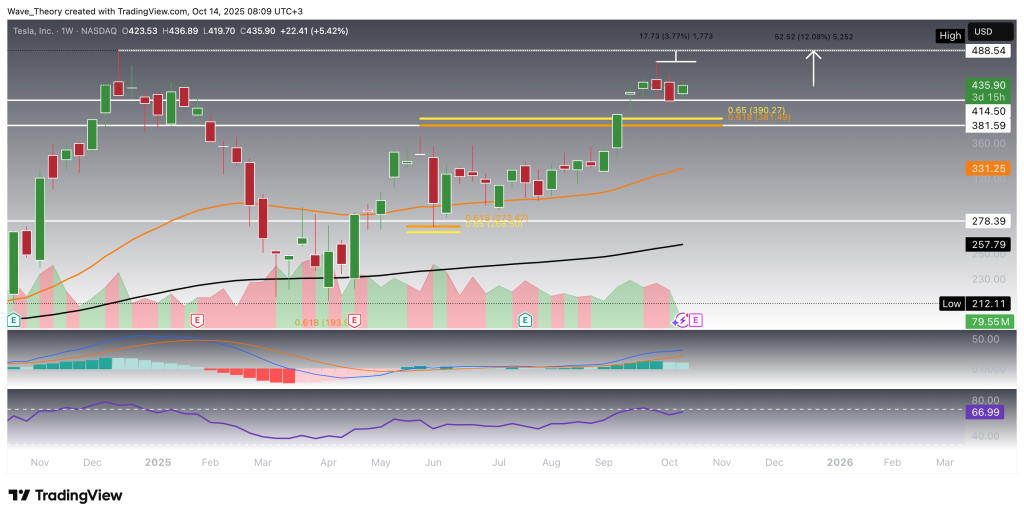
Tesla Stock Encounters Major Resistance at All-Time High of $488.5
Tesla (TSLA) recently approached its all-time high of $488.5, missing it by roughly 4%. Since then, the stock has undergone a two-week corrective phase, declining toward a support zone between $382.6 and $414.5, currently 12% below the ATH.
Technical Indicators:
-
The MACD histogram has been ticking bearishly lower since last week, signaling short-term consolidation.
-
MACD lines and EMAs remain bullishly crossed, confirming that the mid-term trend remains intact.
-
RSI sits in neutral territory, approaching overbought levels, suggesting momentum is strong but caution is warranted for potential near-term pullbacks.
While TSLA faces resistance near the ATH, the overall bullish structure is maintained, with key mid-term indicators supporting further upside once the short-term consolidation completes.
TSLA
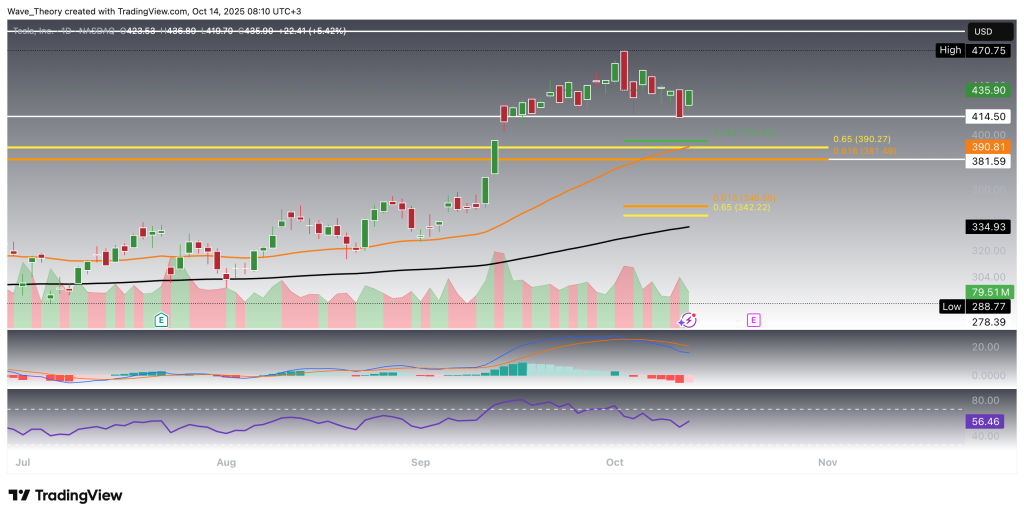
Tesla Stock Approaches Key Support Zones
If Tesla (TSLA) breaches the current support at $414.5, the next significant support zone lies between $381.6 and $395, where multiple Fibonacci levels converge with the 50-day EMA, forming a strong, confluent support area. Should this zone fail to hold, Tesla could retrace further toward the golden ratio support at $345, with the 200-day EMA at $335 providing additional support.
Technical Indicators:
-
EMAs have formed a golden crossover, confirming the trend remains bullish in the short- to medium-term.
-
MACD histogram is ticking bullishly higher, signaling emerging buying momentum.
-
MACD lines remain bearishly crossed, reflecting short-term consolidation.
-
RSI is in neutral territory, suggesting room for either a corrective dip or renewed upward movement.
The confluence of Fibonacci levels and EMAs highlights the $382–$395 zone as critical support. Maintaining these levels would allow Tesla to resume its bullish trend, while a break below could trigger a deeper retracement toward the golden ratio at $345.
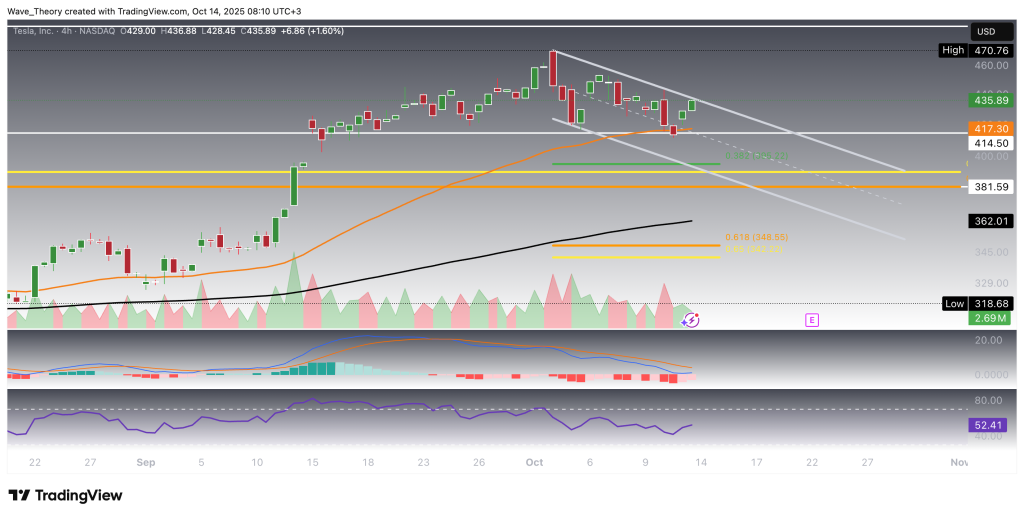
Tesla (TSLA) Stock Trades Within a Downward Channel
On the 4-hour chart, Tesla continues to trade within a short-term downward channel:
-
EMAs remain in a golden crossover, confirming the short-term bullish trend.
-
MACD histogram is ticking bullishly higher, signaling underlying buying momentum, while MACD lines are bearishly crossed, reflecting short-term consolidation.
-
RSI remains in neutral territory, suggesting neither overbought nor oversold conditions.
Currently, the downward channel could exert pressure on the stock, potentially pushing it below the 50-4H EMA at $417. Despite short-term channel pressure, the underlying bullish structure remains intact. Traders should monitor $417 as a critical intraday support within the 4H timeframe, with a break signaling potential further short-term consolidation.
Tesla (TSLA) Technical Summary
Trend Overview:
Tesla has experienced significant volatility over the past year:
-
From ATH to correction: Fell 56% from $488.5 to $194 (golden ratio support).
-
Rebound & rally: Surged ~72% to $380, retraced ~26% to $270, then resumed upward movement.
-
Recent price action: Missed ATH by ~4%, now consolidating 12% below ATH.
Key Technical Indicators:
-
EMAs: Golden cross present on monthly, weekly, daily, and 4H charts — confirming bullish trend in short- to long-term.
-
MACD: Lines mostly bullishly crossed; histogram shows short-term fluctuation but strong upward momentum monthly/weekly.
-
RSI: Neutral in most timeframes; approaching overbought near ATH.
Immediate Resistance:
-
$488.5 — all-time high.
-
$414.5–$382.6 — short-term support consolidation zone.
Support / Fibonacci Levels:
-
$414.5 — current support.
-
$382–$395 — key 50-day EMA + Fibonacci confluent support.
-
$345 — golden ratio support.
-
$335 — 200-day EMA support.
Short-Term Outlook:
-
Trading within a downward 4H channel; 50-4H EMA at $417 is critical.
-
Minor consolidation likely; maintaining support zones above $382–$395 will preserve the bullish mid-term trend.
Mid- to Long-Term Outlook:
-
Trend remains bullish as long as key EMAs and golden ratio supports hold.
-
Break above ATH ($488.5) could trigger next major uptrend continuation.
- Check out our free forex signals
- Follow the top economic events on FX Leaders economic calendar
- Trade better, discover more Forex Trading Strategies
- Open a FREE Trading Account
- Read our latest reviews on: Avatrade, Exness, HFM and XM
Related Articles


Sidebar rates
Related Posts
