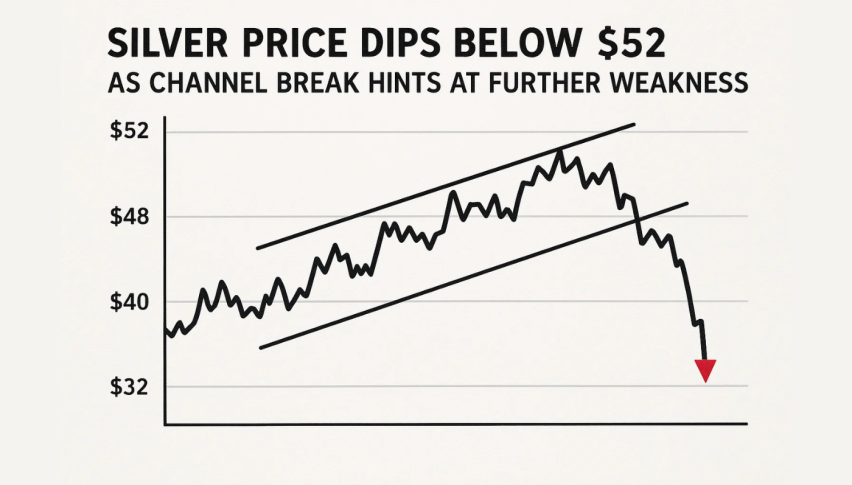
Silver Price Dips Below $52 as Channel Break Hints at Further Weakness
Silver has stopped moving upwards after falling short at the $52.00 mark & this has led to a lot of people thinking that the momentum...
Quick overview
- Silver has struggled to regain upward momentum after failing to surpass the $52.00 mark, raising concerns about a potential trend shift.
- The price has encountered strong resistance at $52.35, coinciding with the 20-EMA and a descending trendline, indicating sellers are regaining control.
- Current candlestick patterns show indecision, but momentum indicators suggest a bearish outlook, with the RSI around 45 signaling sellers remain dominant.
- Traders are advised to wait for clear signals before entering short positions, as a failure to break resistance could lead to further declines.
Silver has stopped moving upwards after falling short at the $52.00 mark & this has led to a lot of people thinking that the momentum might be shifting.
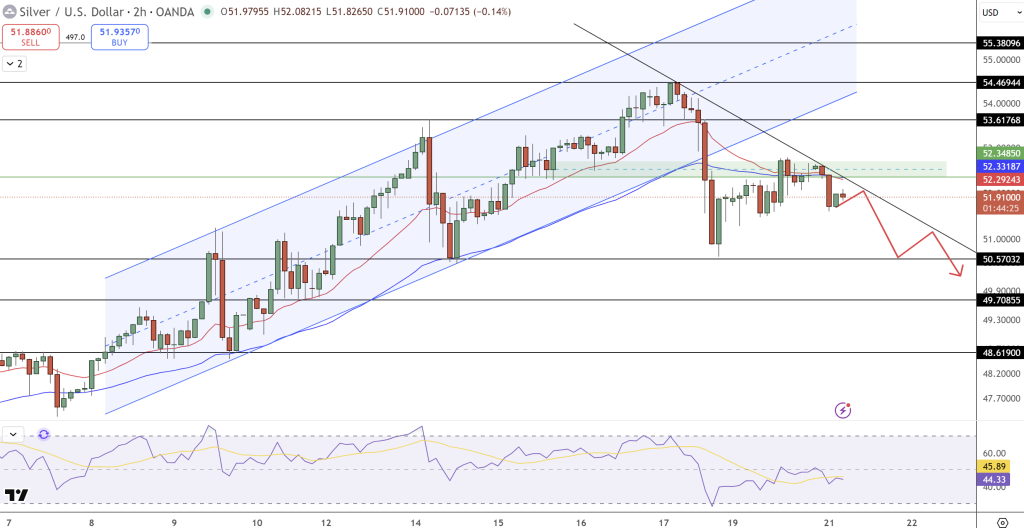
The fact that it hasn’t been able to get back up to the ascending channel it had been following is also causing some concern – especially since it’s hit firm resistance at the $52.35 mark which is right where the 20-EMA is & also a descending trendline.
This spot is notorious for rejecting any attempts by the price to recover, so it looks like the sellers are taking the reins again after a little consolidation period.
On the 2-hour chart, you can really see how the inability to close above this zone is showing a pretty bearish trend – a series of lower highs on the price action is a pretty clear sign that demand from buyers who had been defending the channel is weakening. So it looks like silver might just be consolidating, or maybe even keep falling, unless it can break through its short term resistance cluster.
Bearish Patterns Take Center Stage Now
The candlesticks are showing real indecision at the moment, with small bodied candles & long wicks showing that the fight between buyers & sellers is still pretty evenly matched. But the momentum indicators are definitely leaning bearish at the moment.
The Relative Strength Index (RSI) is pretty subdued at around 45, which is saying that the sellers are still in charge – but since it isn’t in oversold territory yet, there’s still plenty of room for silver to fall further before we might start to see a rebound emerge.
If it can’t close above $52.35 then the losses might just pick up speed, & it’s a pretty good bet we’ll see some action at the $50.57 swing low, or even the $49.70 level where the horizontal support is also lined up with the 100-EMA. On the other hand, if we do see a decisive breakout above $52.35–$52.40 then the bearish setup starts to look a bit shaky & it opens the way to $53.61, which would be a bit of a morale boost.
Silver (XAG/USD) Trade Setup and Risk View for Now
The current situation is probably looking pretty good for some tactical sellers to be on the lookout for confirmation before jumping in however.
- Sell Zone: $52.20–$52.35 (right near the 20-EMA & descending trendline)
- Targets: $50.60 & $49.70
- Stop Loss: above $52.55
- Watch For: any bearish engulfing candles or the RSI dropping below 40
New traders should take a bit of a step back now – patience is key, just wait for that clear rejection candle, or a sign that the momentum is shifting before getting in to short positions.
If the price can’t break the resistance, & the RSI does turn lower then silver is probably going to stay in a downtrend, working its way through the retracement levels before it levels out.
- Check out our free forex signals
- Follow the top economic events on FX Leaders economic calendar
- Trade better, discover more Forex Trading Strategies
- Open a FREE Trading Account
- Read our latest reviews on: Avatrade, Exness, HFM and XM