Amazon (AMZN) Stock Surges to New All-Time High — Is the Rally Just Beginning?

Quick overview
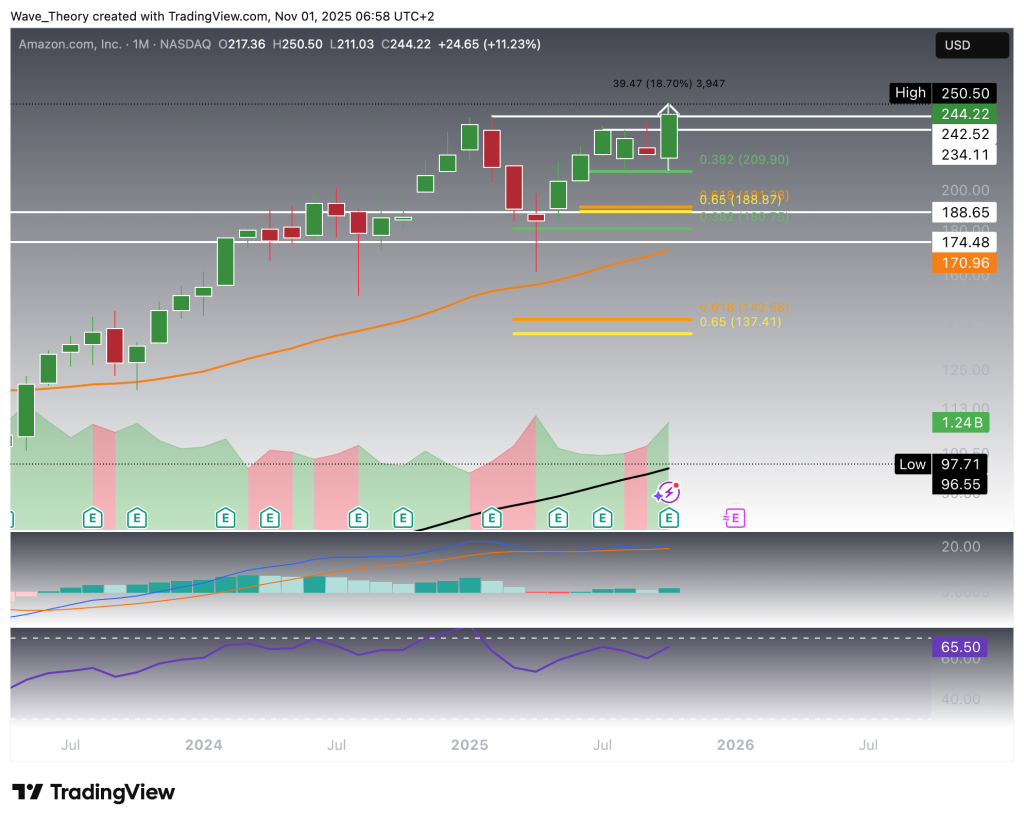
- Amazon (AMZN) has reached a new all-time high of $250.5, reflecting an 18.7% increase this month.
- The stock rebounded from the 0.382 Fibonacci support at $210, marking a significant surge of nearly 19% from recent lows.
- Key resistance levels are identified between $234 and $242.5, while major support levels are at $216.5, $195, and $174–$189.
- Technical indicators, including golden crossovers in EMAs and bullish MACD signals, suggest a strong bullish trend, although the RSI is approaching overbought territory.
Amazon (AMZN) has climbed to $250.5, establishing a new all-time high. The tech giant’s stock has rallied over 18.7% this month, reflecting renewed investor confidence and strong bullish momentum across the broader market.
Amazon Stock Rebounds Bullishly From the 0.382 Fibonacci Support at $210
After initiating a corrective phase last month, Amazon (AMZN) retraced to the 0.382 Fibonacci support at $210, where it bounced strongly to the upside. The rebound propelled the stock to a new all-time high above $250, marking an impressive ~19% surge from its recent lows.
Technically, momentum indicators support the bullish outlook: the MACD histogram has begun to tick higher, while the MACD lines remain bullishly crossed, reinforcing upward momentum. The RSI continues to trade in neutral territory, signaling room for further upside without immediate overbought pressure. Meanwhile, the Exponential Moving Averages (EMAs) have formed a golden crossover, confirming a long-term bullish trend structure for AMZN.
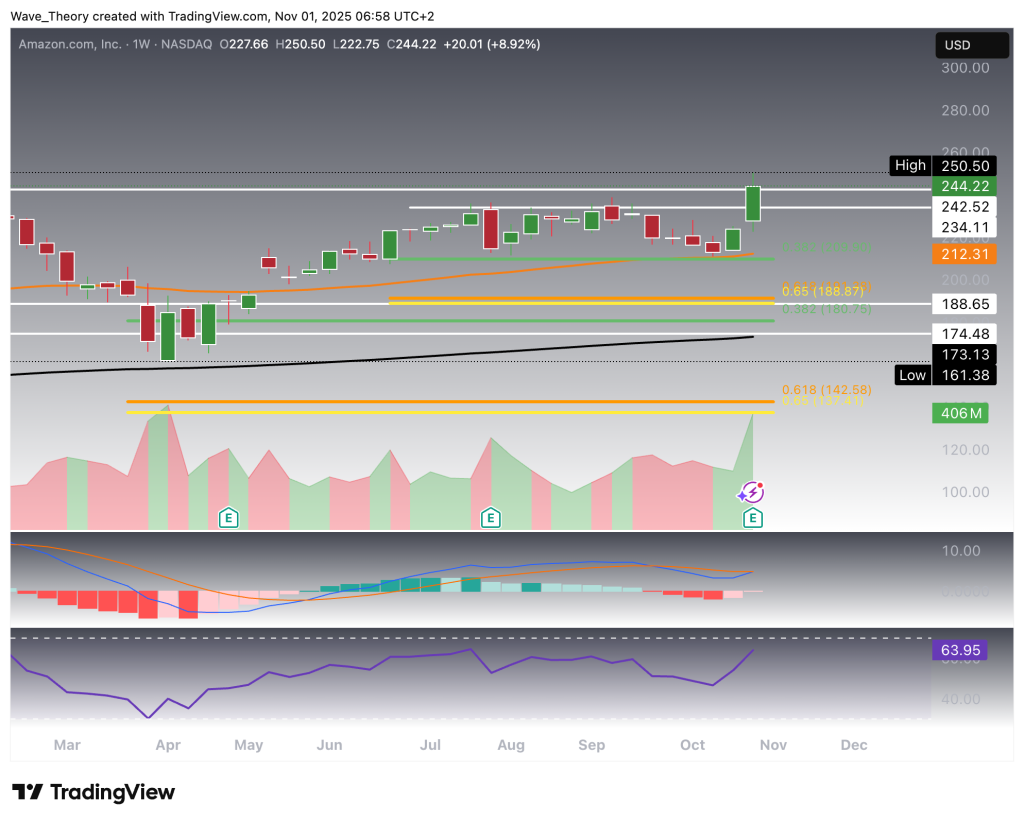
Amazon Stock Encounters Key Resistance Between $234 and $242.5
After finding confluence support at the 0.382 Fibonacci level at $212.3 and the 50-week EMA, Amazon (AMZN) rebounded strongly to the upside. The stock now faces significant resistance between $234 and $242.5, a critical zone that may determine the next directional move.
From a momentum perspective, the MACD histogram has been ticking higher for the past week, indicating strengthening bullish momentum, while the MACD lines are on the verge of a bullish crossover. The RSI remains in neutral territory, suggesting that AMZN still has room to extend gains before entering overbought conditions.
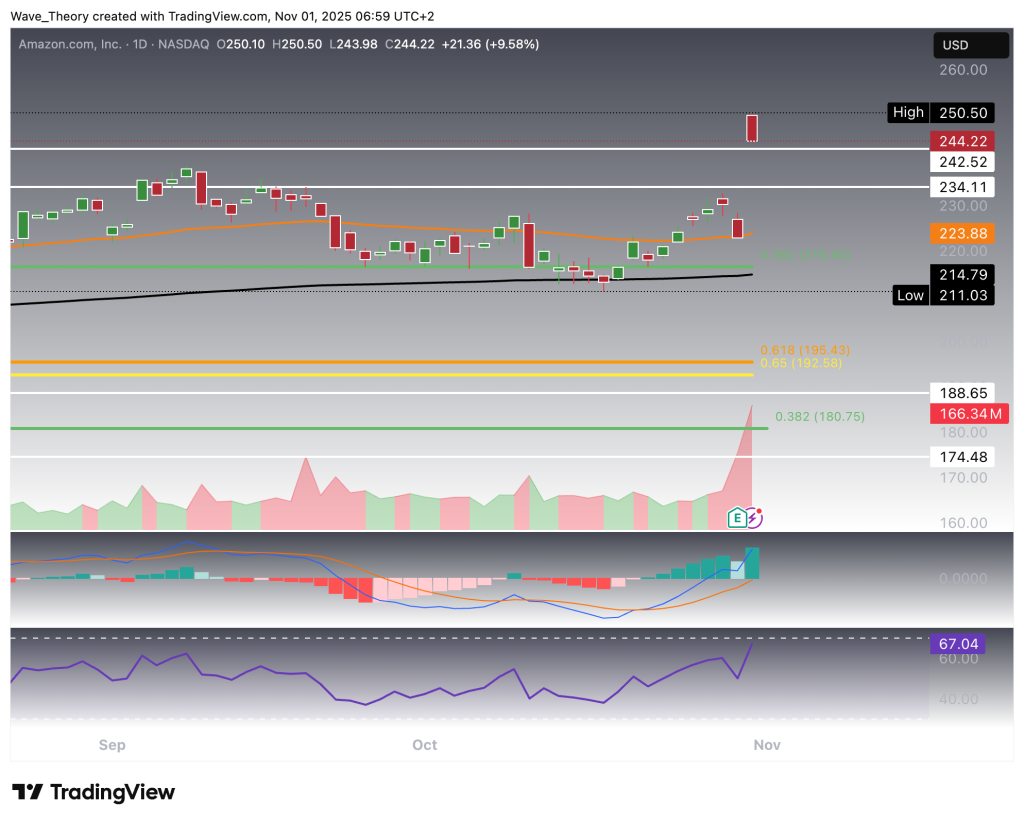
Daily Chart of Amazon Shows Predominantly Bullish Signals
On the daily chart, Amazon (AMZN) continues to exhibit predominantly bullish technical signals. The MACD lines remain bullishly crossed, and the MACD histogram is ticking higher today, confirming ongoing upward momentum. The EMAs display a golden crossover, validating the bullish trend in the short- to medium-term. Meanwhile, the RSI sits in neutral territory, gradually approaching overbought regions. Overall, the daily chart structure reinforces a strong bullish bias, with indicators supporting continued upside potential in the near term.
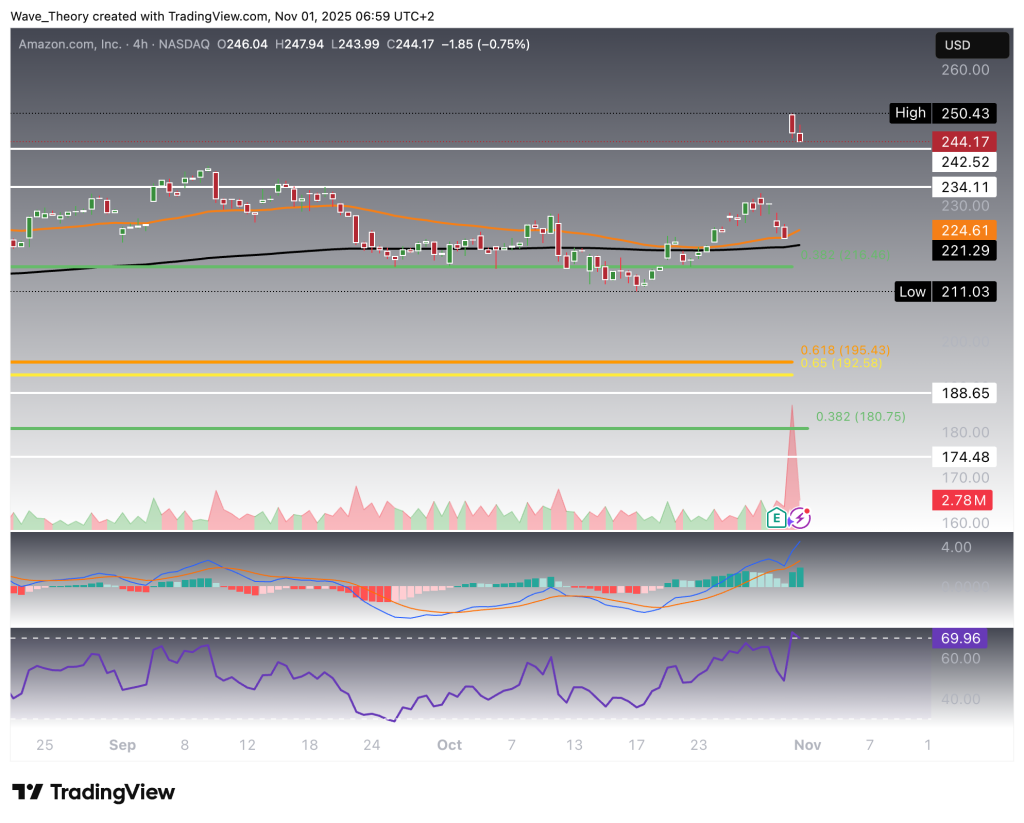
4H Chart of Amazon Paints a Similar Picture
The 4-hour chart reflects a similar bullish setup. The EMAs have formed a golden crossover, confirming the short-term bullish trend, while the MACD lines are bullishly crossed, and the MACD histogram continues to tick higher. The RSI is approaching overbought territory, suggesting that momentum remains strong but may soon face consolidation pressure. Should AMZN retrace, it finds major support at the 0.382 Fibonacci level around $216.5, followed by a key golden ratio support near $195, and a broader support zone between $174 and $189.
Summary — Amazon (AMZN) Technical Outlook
Amazon (AMZN) remains in a strong uptrend after bouncing off the 0.382 Fibonacci support at $210–212, surging to a new all-time high above $250.
In the near term, the stock faces key resistance between $234 and $242.5, while major supports lie at $216.5, $195, and $174–$189.
The EMAs show golden crossovers across all timeframes, confirming the bullish trend in both the short- and long-term outlook. The MACD remains bullish on all major timeframes, though the RSI nears overbought regions, hinting at a potential short-term cooldown before continuation.
- Check out our free forex signals
- Follow the top economic events on FX Leaders economic calendar
- Trade better, discover more Forex Trading Strategies
- Open a FREE Trading Account
- Read our latest reviews on: Avatrade, Exness, HFM and XM
Related Articles


Sidebar rates
Related Posts
