Solana Technical Analysis: SOL Tests Critical $140 Support as Bears Target $100
Solana (SOL) is trading at about $139 at the time of writing. It has been quite stable over the previous 24 hours, even though technical
Quick overview
- Solana is currently trading at approximately $139, showing stability despite building technical pressure that may lead to further declines.
- Institutional demand remains strong, with Solana ETFs experiencing inflows totaling $370 million, although recent inflows have slowed.
- Technical analysis indicates potential downside risks, with critical support levels at $140 and $100, while the relative strength index suggests oversold conditions.
- Short-term projections are cautious, predicting possible price tests between $95 and $126, but long-term forecasts remain optimistic, with potential values reaching $200-$367 by late 2025.
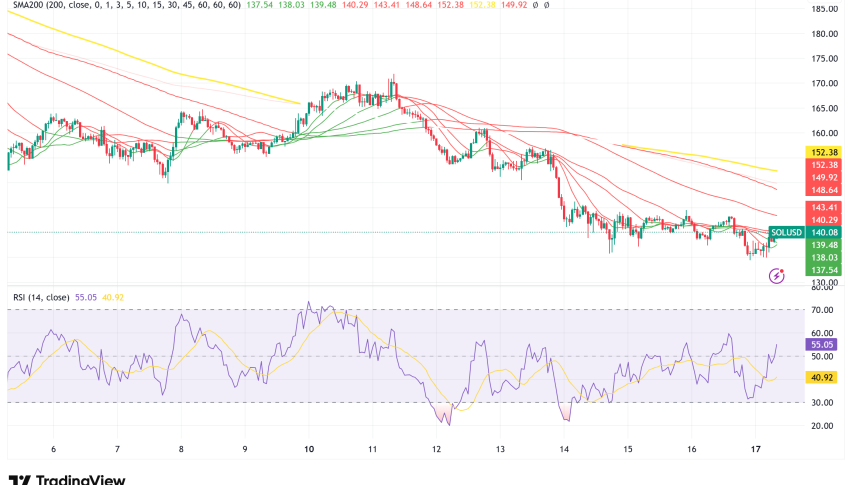
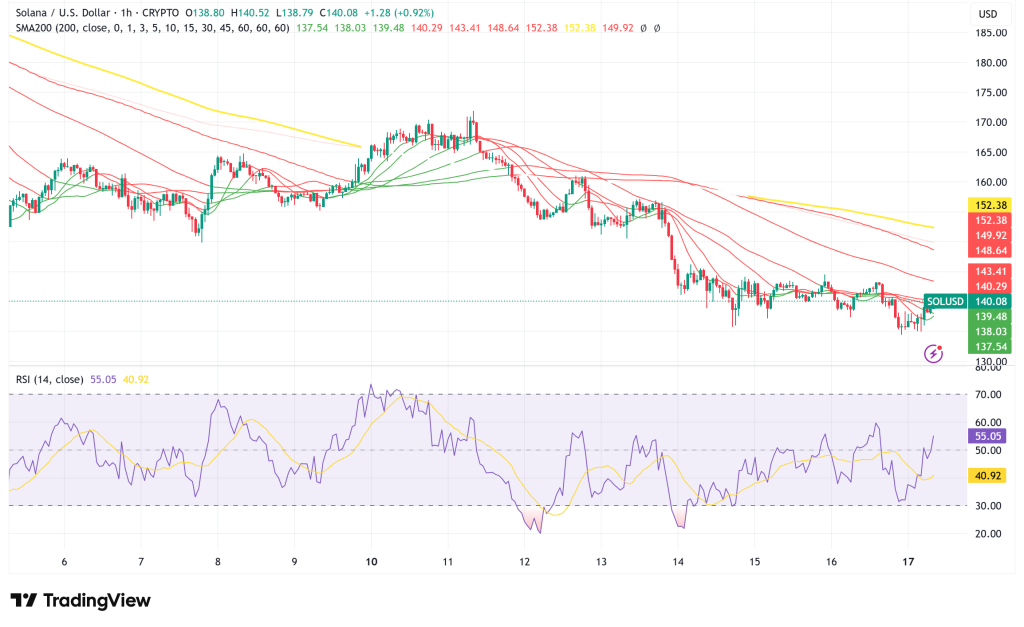
Solana SOL/USD is trading at about $139 at the time of writing. It has been quite stable over the previous 24 hours, even though technical pressure is building that might cause the asset to drop even more.
Institutional Demand Remains Strong Despite Price Weakness
Even though the price is going down, institutional interest in Solana is still strong. Find For the twelfth day in a row, Solana exchange-traded funds have seen inflows, bringing the total to $370 million and the total assets to more over $533 million. Solana ETFs saw $1.49 million in new money on Thursday, however this was the slowest day for new money since the launch on October 28. Only the Bitwise Solana ETF (BSOL) saw positive flows.
This drop in demand for ETFs is similar to the overall market’s downturn. On the same day, Bitcoin ETFs lost $866 million, which was the second-worst performance since debut, and Ethereum ETFs lost $259.2 million. The fact that major cryptocurrencies are all dropping at the same time implies that there are macroeconomic problems affecting all digital asset markets, not just Solana.
SOL/USD Technical Analysis: Further Downside Risk?
In the last two weeks, Solana’s price has dropped drastically, with SOL falling more than 34% to $142 on Friday, its lowest level since June 23. The correction has broken through a number of important technical levels that used to act as support.
Key Technical Breaks
The fact that SOL has fallen below its 100-week simple moving average and the multiyear uptrend line that started in January 2023 is the most worrying thing for bulls. The asset is now testing a daily order block about $140, although Glassnode’s on-chain data suggests that there hasn’t been much demand for it in the past.
Glassnode’s UTXO realized price distribution (URPD) shows the average prices at which holders bought their coins. It shows that there isn’t much clustering of buy levels below $140. There aren’t many solid support zones right now, therefore not many holders are ready to defend the price at these levels. If selling pressure rises, the price might quickly drop.
RSI Signals Oversold Conditions
The relative strength index has dropped to its lowest level since April 2025, which means that the market is very oversold. This could mean that the market will bounce back soon, but momentum traders say that downtrends can stay oversold for a long time before they turn around.
Critical Levels to Watch
- Immediate Support: $140 (current test zone)
- Next Support: $126
- Key Support: $100 (200-week SMA)
- Downside Target: $95 (yearly low)
- Resistance Levels: $150 (liquidity wall), $160, $177 (key breakout level)
Competing Technical Views: Bulls vs. Bears
The Macro Bullish Case
Some experts say that Solana’s overall structure is still positive even though it has recently dropped. Technical expert Jesse Peralta points out that a rounded-base formation is forming below long-standing resistance. This could mean that the long-term consolidation is accumulating energy for a big breakout. This point of view says that the current weakness is a good way to test support again before the next big move up.
The $150 Liquidity Battle
Data on on-chain liquidity shows a lot of short positions around the $150 level, which makes a strong wall of resistance. According to crypto researcher CW8900, these liquidity clusters could behave like magnets, and if buyers can get back into this important area, it could cause a short squeeze. But below present levels, liquidity drops very quickly, which means that additional drops won’t be able to absorb as much.
The Bearish Scenario: Path to $95
If SOL can’t hold the $140 support zone, the technical setup suggests that it could drop below the 200-week simple moving average around $100, which is the final major line of defense for bulls. If the price falls below that level, it might speed up selling toward $95, which is the yearly low set earlier in 2025.
Tony, a crypto analyst, has found a corrective wave structure with lower highs and regular rejections. He points out that overhead resistance in the $160–$177 region has frequently stopped bullish attempts. This study says that any rallies are likely to run into a lot of supply unless SOL can clearly go back to the $177 level.
Market Positioning and Investor Sentiment
Anthony Bassili, president of Coinbase Asset Management, recently talked on where Solana fits within the crypto hierarchy. Bassili said at The Bridge conference in New York that Bitcoin and Ethereum are clearly the first and second choices for investors, while Solana is still in a hesitant third place. He did say, though, that there is a “very wide gap” between Solana and XRP for the fourth spot.
Bassili added, “The market is very unsure about what asset they want to own next after that.” This suggests that even while Solana has strong technology and a growing ecosystem, investors are still not sure what they want to buy after the top two assets.
Solana Price Predictions: Short-Term Caution, Long-Term Optimism
Short-term projections are still gloomy, and most technical indicators say SOL could test lower support levels between $95 and $126 before hitting a bottom. The Fear & Greed Index is at 10 right now, which means there is “Extreme Fear” in the market.
But predictions for the long term are still good. If the current decline doesn’t go too far, a number of analysts think SOL might be worth $149-$164 by early 2026. In more optimistic scenarios, Solana may rise to $200-$367 by the end of 2025. However, these goals would need a big change in how people feel about the market and the ability to protect current support zones.
- Check out our free forex signals
- Follow the top economic events on FX Leaders economic calendar
- Trade better, discover more Forex Trading Strategies
- Open a FREE Trading Account
- Read our latest reviews on: Avatrade, Exness, HFM and XM