Bitcoin Holds Above $87,000 as Market Tests Recovery After Brutal Correction
Bitcoin (BTC) is holding up well today, trading around $87,000 with a 2% gain in the last 24 hours. Investors are trying to figure out if
Quick overview
- Bitcoin is currently trading around $87,000, showing a 2% gain in the last 24 hours as investors assess whether it has reached a local bottom.
- The cryptocurrency experienced a significant drop from its all-time high of $126,210, with a 33% decline leading to over $1.2 trillion lost in the crypto market.
- Analysts indicate that Bitcoin faces immediate resistance at $88,150 and $89,500, while critical support levels are at $85,000 and below.
- Market predictions for Bitcoin's near-term price vary widely, with estimates ranging from $88,244 to $98,000 for November, depending on buying pressure and ETF inflows.
Bitcoin BTC/USD is holding up well today, trading around $87,000 with a 2% gain in the last 24 hours. Investors are trying to figure out if the recent drop has achieved its local bottom or if it will go lower.
Since reaching its all-time high of $126,210 in early October, the flagship cryptocurrency has gone through a lot of ups and downs. On November 21, prices dropped below $81,000 for the first time since April 2025, a 33% drop. The dramatic drop wiped out more than $1.2 trillion from the entire value of all cryptocurrencies, and in only one day, it caused more than $1.9 billion in liquidations.
Bitcoin’s Demand Engines Shift Into Reverse, NYDIG Warns
NYDIG’s chief of research, Greg Cipolaro, says that the correction has happened because the main demand factors that drove Bitcoin’s rise to record highs have changed. Cipolaro said in a note on Friday that the main reasons for the drop were outflows from exchange-traded funds (ETFs) and pressure on digital asset treasuries (DATs).
“ETF inflows and digital asset treasury demand were key to Bitcoin’s last cycle,” Cipolaro said. He went on to say that these supportive flows changed substantially after the October liquidation event. “Once that loop breaks, the market usually follows a set pattern.” Liquidity is tight, leverage tries to re-form but has a hard time getting going, and stories that used to support flows stop doing so.
The spot Bitcoin ETFs, which had been a big success story last time around, have gone from being reliable sources of money to becoming real problems. Treasury premiums have dropped, the supply of stablecoins has gone down for the first time in months, and it looks like investors are pulling money out of the ecosystem. Cipolaro calls this “actual capital flight” instead than just bad sentiment.
BTC/USD Technical Analysis: Critical Support and Resistance Levels
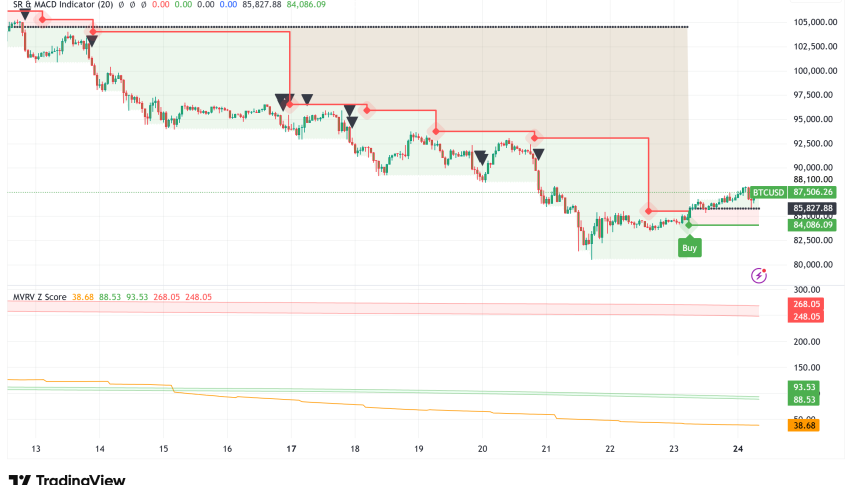
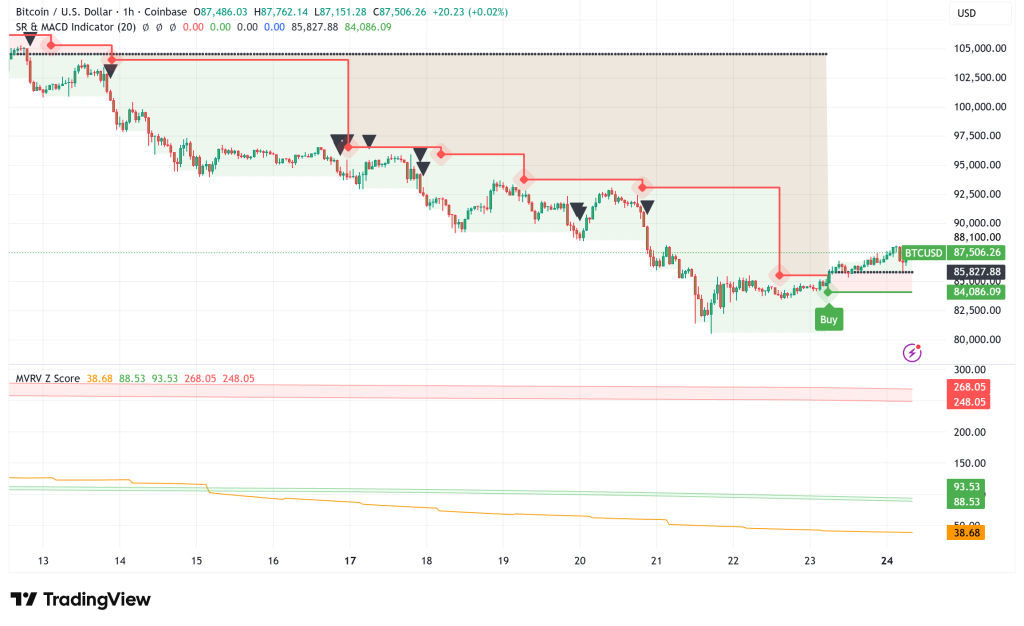
Bitcoin is trying to rebound from a technical point of view, but it will have to deal with a lot of opposition ahead. The cryptocurrency is currently trading below the 100-hour simple moving average and is facing a negative trendline that is emerging with resistance at $89,500.
$88,150 and $89,500 are immediate resistance levels. The latter is the most important barrier that bulls need to break through to get bullish momentum going again. A clear break above $90,000 might lead to a test of $92,500 and maybe even $95,000 in the near future.
On the other hand, there is important support at $85,000 and more support at $83,500 and $82,500. If Bitcoin doesn’t stay over $80,000, analysts say it might drop even more quickly. The Relative Strength Index (RSI) is currently at 50 on the hourly period, which means that the momentum is neutral. The MACD indicator, on the other hand, shows that bearish momentum is getting weaker.
The technical indications show a variety of things. Some assessments say that the RSI has dropped below 22.65, which is considered oversold. This usually means that there may be good buying chances, but this can happen during significant downtrends. The 200-day simple moving average, on the other hand, has been going up since early 2025 and is still supporting the long-term positive trend.
MVRV Analysis Points to Deeper Correction Potential
Market researcher Ali Martinez has found possible downside targets using MVRV Pricing Bands. These bands show if Bitcoin is overpriced or undervalued compared to the average price investors pay. When Bitcoin drops below the 1.0x Realized Price threshold, which is now $55,914, it usually sets local bottoms.
In more extreme cases, Bitcoin might test the 0.8x Realized Price barrier around $44,713, which would mean a drop of 35% to 48% from where it is now before finding a clear bottom. Martinez, on the other hand, says that these kinds of big falls have happened in past Bitcoin cycles and don’t necessarily mean that the bullish thesis is falling apart.
Bitcoin Price Prediction: Near-Term Outlook Remains Uncertain
Analysts have very different short-term price estimates, which shows how unsettled the market is right now. Conservative predictions say that Bitcoin might stay in a range of $88,244 to $98,000 for the rest of November. If purchasing pressure builds, it could even hit $90,198 by the end of the month.
Several analysts still think that the price will go back to $95,000 to $98,000 if current support levels hold. This is a more positive medium-term forecast for December 2025. Some optimistic scenarios have Bitcoin rising to $112,000–$116,000 by the end of November if the economy stabilizes and ETF inflows start up again.
Technical analysts agree that the trading range for 2025 will be between $77,000 and $155,000, but getting there will probably be hard and erratic. The worry & Greed Index is at 13 out of 100 right now, which is a sign of high worry in the market. This has traditionally been a sign of possible buying opportunities for long-term investors.
- Check out our free forex signals
- Follow the top economic events on FX Leaders economic calendar
- Trade better, discover more Forex Trading Strategies
- Open a FREE Trading Account
- Read our latest reviews on: Avatrade, Exness, HFM and XM