Bitcoin Struggles to Maintain $86,000 Support as Market Faces Critical FOMC Decision
Bitcoin (BTC) is currently above $86,000, which is a sign of relative stability over the previous 24 hours. This is despite the fact that
Quick overview
- Bitcoin is currently trading above $86,000, showing relative stability despite a 21% drop in value over the past month.
- The cryptocurrency is stuck in a trading range between $80,600 and $96,000, with a lack of robust spot buying pressure hindering upward momentum.
- Macroeconomic factors, including uncertainty around the Federal Reserve's interest rate policy, are contributing to market volatility and risk aversion among traders.
- The outlook suggests Bitcoin will likely remain range-bound until the FOMC meeting, with potential for both bullish and bearish scenarios depending on market conditions.
Bitcoin BTC/USD is currently above $86,000, which is a sign of relative stability over the previous 24 hours. This is despite the fact that the top cryptocurrency has dropped almost 21% in value over the past month. Bitcoin shot up to almost $93,300 last week, but it hasn’t confirmed a bullish trend reversal. On Monday, prices fell below $85,000 before bouncing back to where they are now.
BTC/USD Technical Analysis: Range-Bound Trading Dominates
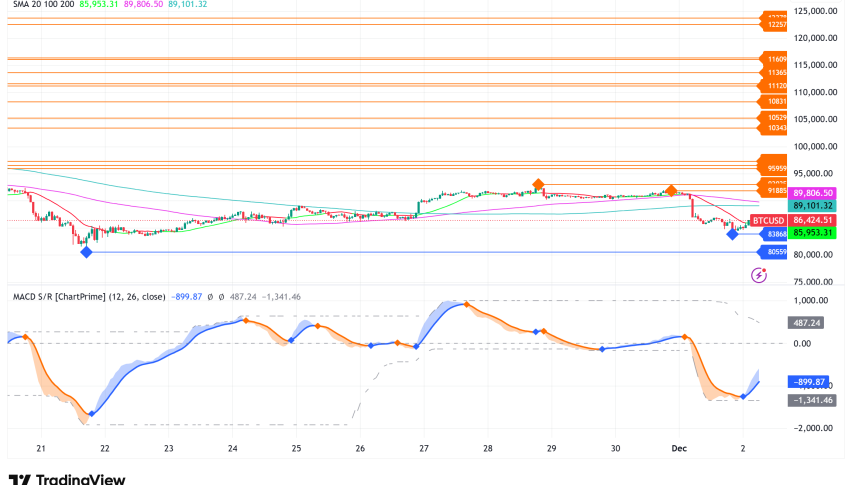
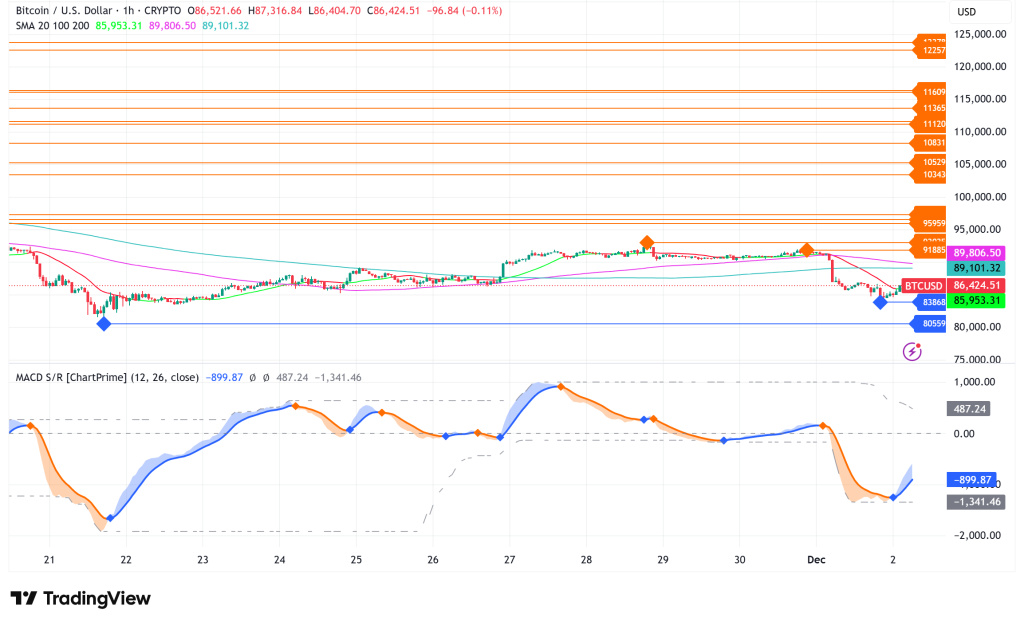
Bitcoin’s current technical picture shows that it is stuck in a clear trading range. Last week, the asset tried to close above the important $93,000 resistance zone, but it couldn’t keep up the pace, which started a mean-reversion trend that brought prices back down to support levels.
The lack of robust spot buying pressure is the most pressing issue for bulls right now. Technical research shows that Bitcoin is now stuck between $96,000 (the top of the recent range) and $80,600 to $84,000 (an on-chain cost-basis floor where more than 400,000 BTC were stored). This accumulation zone has made a support floor, but without new demand, the price might still go down more.
Most of the important technical indicators show a mixed picture. The Simple Moving Average (SMA) has been a continuous support level since mid-October, which suggests a bullish structure. On the other hand, the Moving Average Convergence Divergence (MACD) shows a persistent decrease on the daily timescale. This difference shows that the long-term trend is still positive, but the short-term momentum has dropped a lot.
There are liquidity clusters on both sides of the present range, so a breakthrough in either direction might cause big, unpredictable changes. From a bullish point of view, testing the lower range again around $80,600–$84,000 might be helpful because it would let Bitcoin take in more downward liquidity and develop a stronger base before trying to climb again. On the other hand, pushing right away into $93,000–$96,000 without first gathering liquidity below could lead to more selling pressure.
Bitcoin’s Spot Market Weakness Signals Deeper Issues
One of the most worrying things for Bitcoin bulls is that demand in the spot market has been poor for a long time. BTC has had a harder time keeping its upward momentum beyond $93,000 because there isn’t much liquidity in the market and the order book isn’t very deep. A lot of short-term investors are still below their average entry price of $104,600, which makes it hard to find the right price because there isn’t much liquidity.
But there are indicators that a lot of buying power might be waiting on the sidelines. According to CryptoQuant, Binance’s Bitcoin-to-Stablecoin Reserve Ratio has dropped to its lowest level since 2018. This means that there are more stablecoins than ever willing to buy BTC. In the past, these kinds of abnormal ratios have come before big rallies. Demand for spot is still low, but this stablecoin overhang shows that there is a lot of buying power out there; it’s just not being used right now.
Macroeconomic Headwinds Mount
You can’t talk about Bitcoin’s recent price movements without also talking about bigger economic issues. Several things have come together to make it hard for risk assets, like cryptocurrencies, to do well.
On Monday, the cryptocurrency market saw a big sell-off that wiped away $388 million in bullish leveraged positions. Some of the things that led to this were rising yields on Japanese 20-year government bonds (the highest level in 25 years), China’s central bank putting pressure on the use of stablecoins in unlawful operations, and more worries over AI businesses’ GPU-backed debt.
Uncertainty over the Federal Reserve’s meeting on December 9 and 10 has kept a lot of traders from getting involved, which is perhaps the most important thing. People are keeping a close eye on US interest rate policy, and without clear guidance, their willingness to take risks has dropped a lot. Lower interest rates usually help cryptocurrencies by making the market more liquid and encouraging people to take risks. However, recent economic data has made it unclear what the Fed will do next.
The rules and regulations have also made the market uneasy. S&P Global Ratings lowered Tether’s stablecoin reserves to the lowest level attainable because they kept finding holes in the company’s disclosures. After this adjustment, USDT started trading at a 0.4% discount to the official USD/CNY rate in China, which meant that there was moderate selling pressure. Concerns about strategic digital-asset reserve businesses like Strategy (formerly MicroStrategy) selling below their net asset value have also made the market more nervous.
Bitcoin Price Prediction and Outlook
Bitcoin looks like it will stay in a range for the time being, given the current technical and fundamental situation. The most likely thing to happen is that prices will stay between $80,600 and $96,000 until the FOMC meeting on December 9 and 10.
Bullish scenario: If Bitcoin can successfully retest and maintain the $80,600–$84,000 support zone while absorbing liquidity, it might set up a firmer base for a rally toward $96,000 and maybe even higher to retest the $100,000 psychological mark. If good events like a dovish Fed decision or better risk sentiment happen, the huge amount of stablecoin reserves on exchanges might lead to such a shift.
Bearish scenario: If the $80,600 support level doesn’t hold, the market could go down even more, possibly to the $75,000–$78,000 zone. If the Federal Reserve hints at a more hawkish position or if the overall state of the economy continues to become worse, this is what would probably happen.
Base case: The most likely scenario is that Bitcoin will stay in a horizontal range for a few weeks, moving back and forth inside that range until the FOMC meeting gives clear guidance or spot demand picks up significantly. Traders could expect more volatility in this range as liquidity on both sides is tested.
- Check out our free forex signals
- Follow the top economic events on FX Leaders economic calendar
- Trade better, discover more Forex Trading Strategies
- Open a FREE Trading Account
- Read our latest reviews on: Avatrade, Exness, HFM and XM
Related Articles


Sidebar rates
Related Posts
