Ethereum’s Valuation Defended as ‘Smart Money’ Whale Scales $280M Long
Ethereum (ETH) is currently trading at $3,200, down 2.7% in the last 24 hours, going through a very critical technical juncture. Even if the
Quick overview
- Ethereum is currently trading at $3,200, down 2.7% in the last 24 hours, facing a critical technical juncture.
- Recent whale accumulation suggests that smart money may be preparing for a significant market move despite cautious overall sentiment.
- Technical analysis indicates that Ethereum must break through the $3,350–$3,420 resistance zone with high volume to establish a trend reversal.
- A valuation debate is ongoing, with some arguing that Ethereum should be viewed as an early-stage technology rather than a mature asset.
Ethereum ETH/USD is currently trading at $3,200, down 2.7% in the last 24 hours, going through a very critical technical juncture. Even if the price action is still choppy, recent whale accumulation and a new debate about Ethereum’s underlying value hint that smart money may be getting ready for a big move. This is true even though the overall market mood is still cautious as the Federal Reserve’s next FOMC meeting approaches.
ETH/USD Technical Analysis: Testing the Boundaries of a Potential Reversal
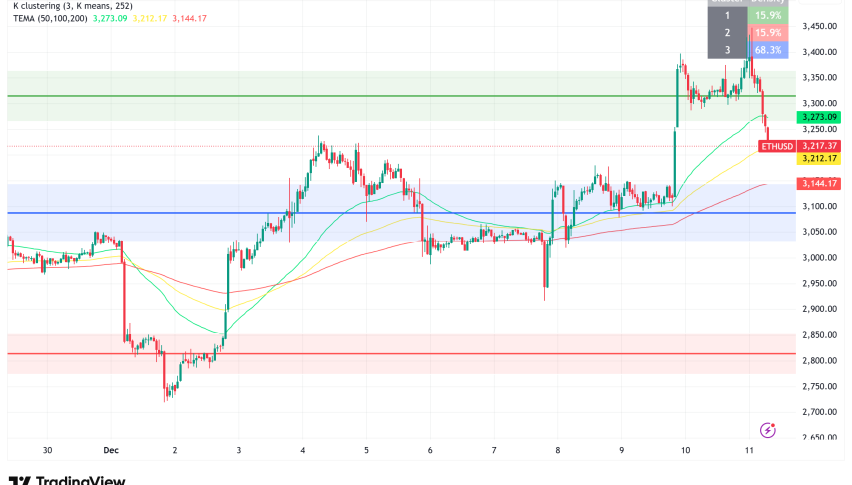
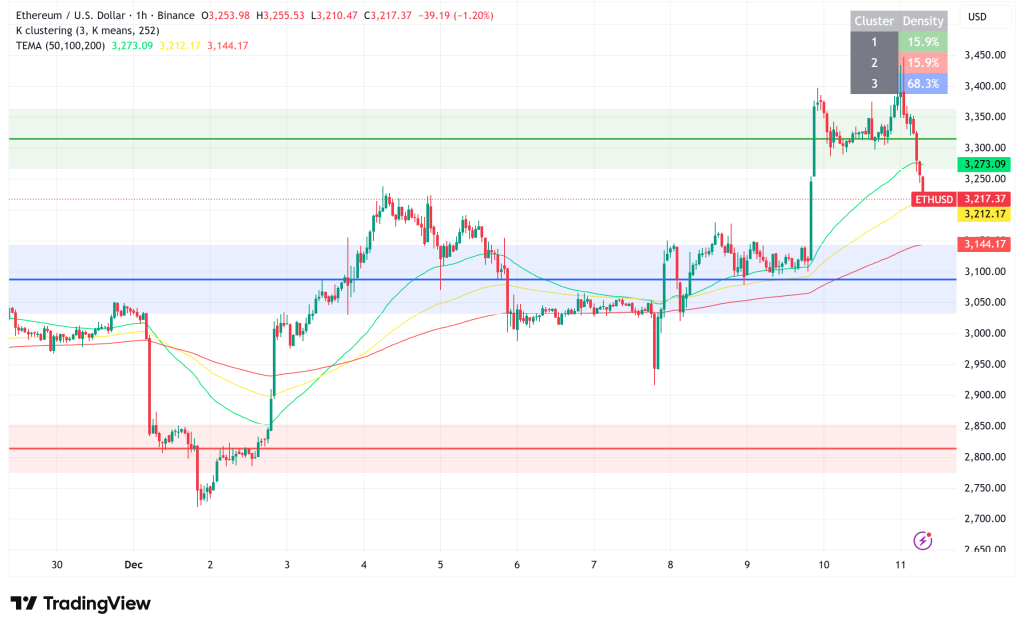
The way Ethereum’s price has been moving lately shows that the market is changing. ETH broke through $3,300 and briefly tested $3,400, but it has now dropped back to $3,200, which is now a key level of support. The 4-hour chart reveals that Ethereum has successfully recaptured both the 50 EMA and 100 EMA. This is one of the biggest bullish impulses since early November. The 200 EMA, on the other hand, is still acting as dynamic barrier, and ETH is still stuck below the important $3,350–$3,420 resistance zone that sellers have always resisted.
The daily chart shows a similar range of information. Since the capitulation-like plunge to below $2,800 in November, Ethereum has made a series of higher lows. However, the 50-day and 100-day moving averages are still above the current price levels and are both sloping down. This technical setup shows that ETH is still moving in a larger downward pattern, even though there have been signs of stabilization recently.
Volume analysis shows that participation is relatively low during the present recovery phase. This suggests that buyers are active, but broad-based conviction is still restricted. Ethereum has to break through and stay above the $3,400 resistance zone with high volume in order to establish a real trend reversal.
Ethereum Whale Positioning Signals Contrarian Conviction
Even if there is some technical ambiguity, on-chain data shows that smart players are aggressively accumulating. Lookonchain says that BitcoinOG, a well-known whale who made a lot of money shorting Bitcoin during the market meltdown in October, has doubled down on his Ethereum long position. He now owns 85,001 ETH, which is worth over $280 million, and he has more than $16 million in unrealized earnings.
This position is especially interesting because of when it happened. BitcoinOG has increased his exposure during a time when most traders are still being careful, instead of taking profits after ETH’s recent rise toward $3,400. A trader with an established track record who is aggressively buying signals that they believe the market could soon flip in favor of higher pricing.
But this whale behavior is happening right before a FOMC meeting, which could have a big effect on liquidity and risk appetite for all assets. A dovish rate decision might make people feel better about the economy and lower the value of the US dollar, which could lead to more gains. On the other hand, a hawkish tone could cause people to sell the news, especially because ETH is close to resistance.
Valuation Debate: Should Ethereum Trade Like Amazon?
Haseeb Qureshi, a managing partner at Dragonfly, has brought up the question of how to properly value Ethereum again, adding another layer to the present market dynamics. Qureshi said on the Milk Road Show that detractors are using the incorrect financial framework and that ETH should be looked at more like an early-stage Amazon than a mature value stock.
The main point of Qureshi’s argument is a controversial one: he says that fee revenue on Ethereum is really pure margin and should be seen as profit, not revenue in the usual business sense. “Blockchains don’t make money.” “They have profit,” Qureshi said. “When chains collect fees, they make money. A chain doesn’t have any costs.
This approach immediately goes against what investor Santiago Santos said when he said that Ethereum is trading at more than 300 times sales, which he labeled “embarrassing” compared to traditional corporations. Qureshi says that for blockchains, what equity investors call “sales” is more like the GDP or GMV of the on-chain economy, which isn’t quantified directly at the protocol level. If he assumes that “fees equal profit,” the price-to-sales and price-to-earnings ratios for Ethereum come together around 300–380x.
Qureshi points out that Amazon took almost 20 years to become profitable despite being the most popular platform, yet in 2013, public markets gave it a P/E ratio of over 600. Ethereum’s current 380x multiple, on the other hand, seems fair for a technology that is still in the early stages of growth. “What has changed in the last two months that made ETH move from $4,800 to $3,000? Qureshi said, “The answer is basically nothing,” which means that recent price changes are more about how people feel than about any real problems with the economy.
Ethereum Price Outlook: Critical Levels to Watch
In the near term, Ethereum faces a decisive test. If buyers can establish firm support at $3,200 and push through the $3,350–$3,420 resistance zone, a move toward $3,500 becomes increasingly likely, particularly if the FOMC delivers a market-friendly outcome. Successfully reclaiming the 200-day moving average would mark an important technical milestone and could attract momentum-based buyers.
Conversely, failure to hold $3,200 support could trigger a pullback toward the $3,000–$3,100 range, where the recently reclaimed moving averages would be tested as support. A breakdown below $3,000 would invalidate the recent bullish structure and potentially open the door to a retest of the November lows near $2,800.
- Check out our free forex signals
- Follow the top economic events on FX Leaders economic calendar
- Trade better, discover more Forex Trading Strategies
- Open a FREE Trading Account
- Read our latest reviews on: Avatrade, Exness, HFM and XM