Bitcoin Holds Above $88K as Miner Capitulation Signals Potential Bottom Formation
Bitcoin is holding steady above $89,000 as December 2024 comes to an end. This is almost 30% lower from its all-time high of $126,080 in Oct
Quick overview
- Bitcoin is currently trading above $89,000, nearly 30% lower than its all-time high of $126,080 from October.
- A recent decline in Bitcoin's hashrate may indicate a contrarian buying opportunity, historically leading to positive returns.
- The mining environment is challenging, with breakeven energy costs dropping significantly, impacting miners' profitability.
- Bitcoin's price outlook remains uncertain, with critical support levels around $85,000-$86,000 and resistance at $90,000.
Bitcoin BTC/USD is holding steady above $89,000 as December 2024 comes to an end. This is almost 30% lower from its all-time high of $126,080 in October. The price movement is still low in the medium term, but a mix of technical considerations and miner capitulation signals may be setting the ground for a big comeback in early 2025.
Historical Hashrate Declines Point to Contrarian Buying Opportunity
Recent research from VanEck shows that Bitcoin’s hashrate fell 4% in the month ending December 15. This is the biggest dip since April 2024. This is an important historical event since long-term hashrate compression has been an indication of bullish sentiment. Matt Sigel, the head of VanEck’s crypto research, and Patrick Bush, a senior investment analyst, said that since 2014, Bitcoin’s 90-day forward returns have been positive 65% of the time when the network’s hashrate drops during a 30-day period. When the hashrate rises, however, they have only been positive 54% of the time.
The pattern gets increasingly more interesting as time goes on. Negative 90-day hashrate increase has been followed by positive 180-day Bitcoin returns 77% of the time, with an average gain of 72%. This does a lot better than the 61% positive return rate shown when hashrate goes up over similar time frames.
Bitcoin Mining Economics Reach Critical Inflection Point
The current mining environment puts a lot of stress on operators. The breakeven price for energy for a Bitmain S19 XP miner from 2022 has dropped by almost 36%, from $0.12 per kilowatt-hour in December 2024 to just $0.077/kWh by mid-December. This sudden drop shows how hard it is for miners to make money at the present price of Bitcoin.
The recent drop in hashrate was mostly caused by the closing of about 1.3 gigawatts of mining capacity in China. VanEck analysts say that a lot of this power may be used for AI infrastructure instead. This tendency might cut Bitcoin’s total hashrate by as much as 10%, making it much harder for the miners who are still in the game to compete.
But not all places are giving up on Bitcoin mining. VanEck found that mining operations are currently supported by up to 13 countries, including Russia, France, Bhutan, Iran, El Salvador, the UAE, Oman, Ethiopia, Argentina, Kenya, and Japan. This regional diversity could help keep the network stable, even if some areas move away from mining cryptocurrencies.
BTC/USD Technical Structure Reveals Fragile Support Levels
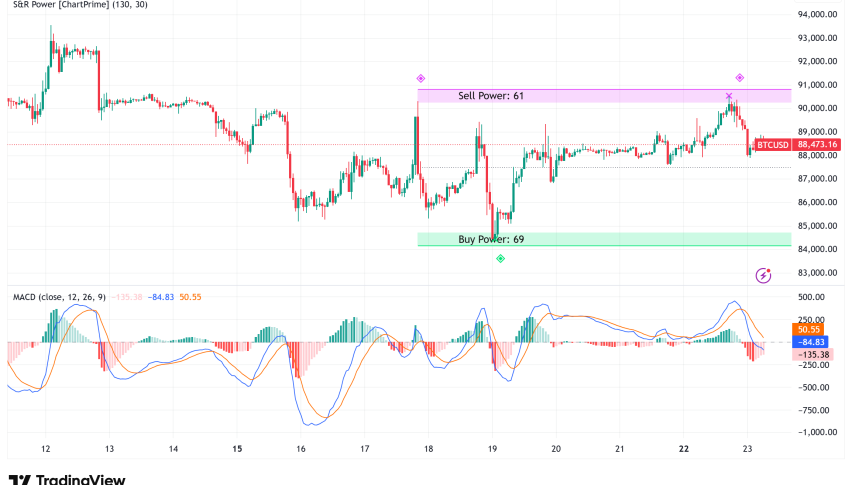
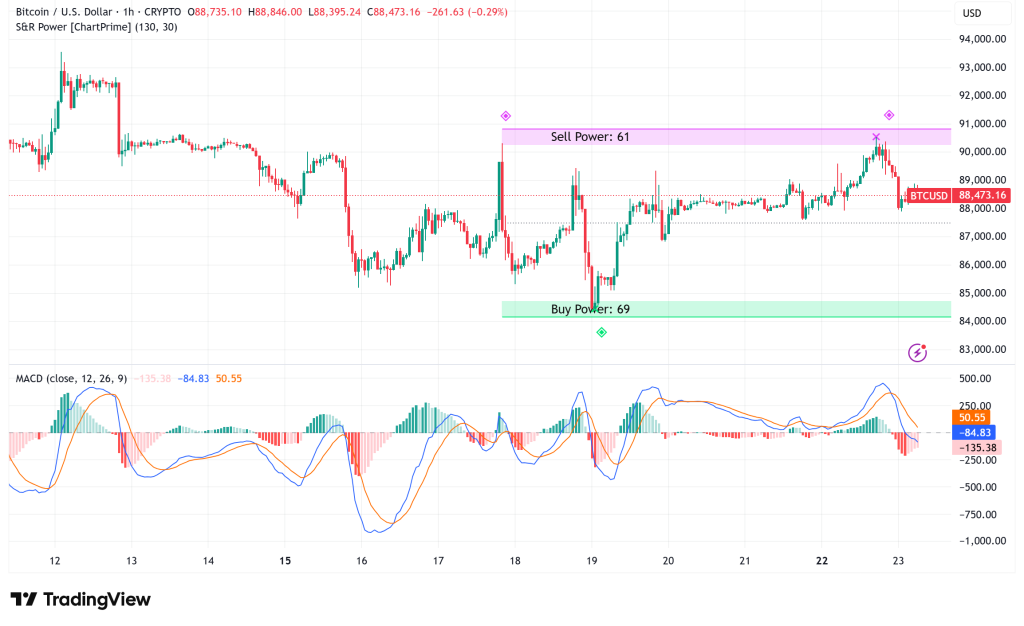
From a technical point of view, Bitcoin’s price movement is still structurally weak. The cryptocurrency is trading slightly below the $90,000 mark, which is important for the mind. It used to be support, but after recent breakdowns, it has become near-term resistance. There has been some purchasing interest, but it hasn’t changed the bearish pattern that formed following the highs in October.
On the 3-day chart, Bitcoin is currently below its 50-period moving average, which has started to slope down and show that momentum is slowing down. The fact that this level hasn’t been reached again shows that the recent upward swings are more of a correction than an impulse. The 100-period moving average is about $85,000 to $86,000 and has helped maintain the recent rise. If this zone keeps losing, Bitcoin is likely to drop much farther toward the 200-period moving average in the mid $80,000 range.
The current sell-off happened with a lot of volume, but the bounce that followed has happened with less volume. This difference shows that purchasers aren’t sure what to do, which supports the idea that Bitcoin is still stuck in a range with lower highs and less volatility.
Gold-Bitcoin Rotation Narrative Faces Scrutiny
Gold XAU/USD recently hit a new all-time high of more than $4,420 per ounce, which has led to more talk about the possibility of money moving from traditional safe-haven investments to Bitcoin. Analyst Darkfost, on the other hand, has questioned this generally held view, saying that there is still not enough data to explicitly link gold’s outperformance to persistent Bitcoin inflows.
Darkfost created a comparative framework that looked at times when Bitcoin trades above its 180-day moving average and gold trades below its own 180-day moving average. He observed that these so-called rotation signals don’t always give accurate or consistent results. In some cases, expected rotating periods did not lead to long-lasting Bitcoin gains, and in other cases, Bitcoin rose on its own, not following gold’s trajectory.
This analysis shows that the movement of capital between gold and Bitcoin is much more complicated than most people think. It is not just a simple transfer from one asset to another; it is driven by larger macroeconomic factors, liquidity dynamics, and investor positioning.
Institutional Interest Provides Long-Term Foundation
Even if there is uncertainty in the short term, more and more institutions are becoming involved. Even though the iShares Bitcoin Trust (IBIT) had negative returns for the year, it brought in $25 billion in inflows this year. Eric Balchunas, an analyst for Bloomberg ETF, pointed out that IBIT was the only fund in the top group that had negative returns but still got a lot of money, which means it may get a lot of money during good market years.
But lately, people have been more cautious, and some analysts have even talked about the potential that Bitcoin is entering a bear market phase. Maksim Balashev, the founder of Santiment, said that BTC might drop to $74,000. He pointed out that there is a lot of online optimism that usually comes before more corrections.
Bitcoin Price Outlook: Critical Levels Define Near-Term Path
To change its bearish bias, Bitcoin bulls need to get back over $90,000 and the 50-period moving average, which is going down. Price movement promotes range-bound trading until these levels are safe, but there is still a chance of going down.
If the market goes down, a break below the $85,000-$86,000 support zone would likely lead to a test of the $80,000-$82,000 area, which is where the 200-period moving average sits. Some analysts who keep an eye on sentiment indicators say that a more serious drop might go as far as $74,000–$76,000.
On the other hand, if Bitcoin can go back to $90,000 and keep going up from there, it will be able to test the December highs around $95,000–$98,000. If the price stays over $100,000, it would show that the bulls are back in charge and could go for new all-time highs between $110,000 and $120,000.
- Check out our free forex signals
- Follow the top economic events on FX Leaders economic calendar
- Trade better, discover more Forex Trading Strategies
- Open a FREE Trading Account
- Read our latest reviews on: Avatrade, Exness, HFM and XM