Ethereum at the $3,300 Crossroads: Why a “Liquidation Flush” May Be the Key to $5,000
Ethereum (ETH) is trading at about $3,300 right now. It has stayed very stable over the past 24 hours as the market settles down after
Quick overview
- Ethereum is currently trading at approximately $3,300, showing stability after recent market fluctuations.
- Technical indicators suggest a potential short-term drop to the $3,050-$3,170 support zone before a rally towards $4,100.
- Despite recent gains, Ethereum's Spent Output Profit Ratio indicates many holders may still be at a loss, which could affect selling behavior.
- Long-term projections suggest that if Ethereum breaks above $3,300, it could aim for $5,000 and potentially reach $8,400 by late 2026.
Ethereum ETH/USD is trading at about $3,300 right now. It has stayed very stable over the past 24 hours as the market settles down after recent increases. The price action looks quiet on the surface, but underlying technical indications and the way the futures market works imply that big changes are about to happen, but maybe not until one more shakeout.
ETH Leverage Ratio Signals Familiar Pre-Rally Pattern
Ethereum’s futures markets are starting to show a strong technical setup that has led to big price increases in the past. Pelin Ay, a crypto expert, said that ETH’s Leverage Ratio on Binance has risen to about 0.60, which is a level that has always caused rallies of 10% to 25% throughout 2025.
The pattern is very consistent: when the Leverage Ratio rises sharply above price action, it usually causes short-term downside wicks that close out long positions that are over leveraged, followed by strong upward advances. This sequence happened several times in 2025, with notable ones in February, April, September, and November.
Even if prices have gone up recently, the leverage ratio is still high, which shows that traders are still willing to take risks. Based on what has happened in the past, Ethereum might have one last liquidity sweep, which would be a quick drop, before starting a long rally that might bring prices up to $4,100 or more.
Divergence in Holder Conviction Raises Questions
Even if Ethereum has been doing well lately, not all signs are pointing up. Sean Rose, an analyst at Glassnode, has found a worrying difference in how holders act. Since the lows in January, ETH has done better than Bitcoin, but Ethereum’s Spent Output Profit Ratio (SOPR) is still below 1. This means that the total realized losses on the network are still more than the total profits.
This is very different from people who own Bitcoin, who have better belief metrics. The low SOPR reading shows that a lot of ETH holders may still be losing money on their investments. This could make people want to sell during rallies and slow down the pace compared to prior cycles.
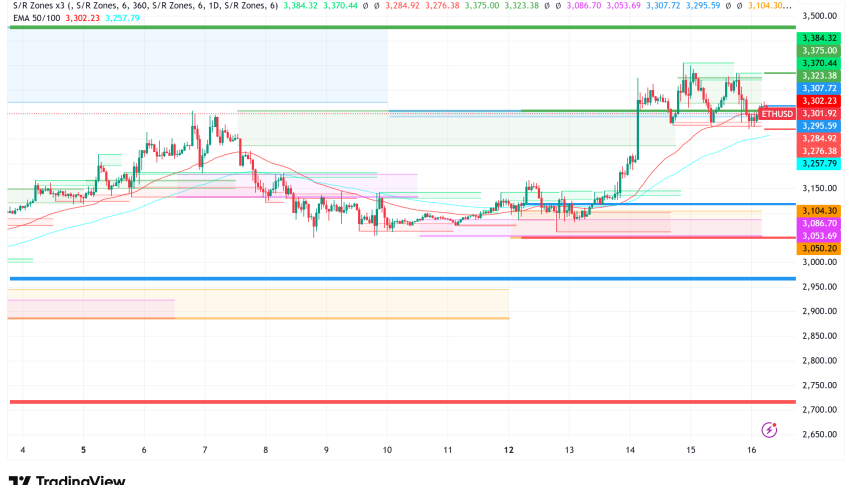
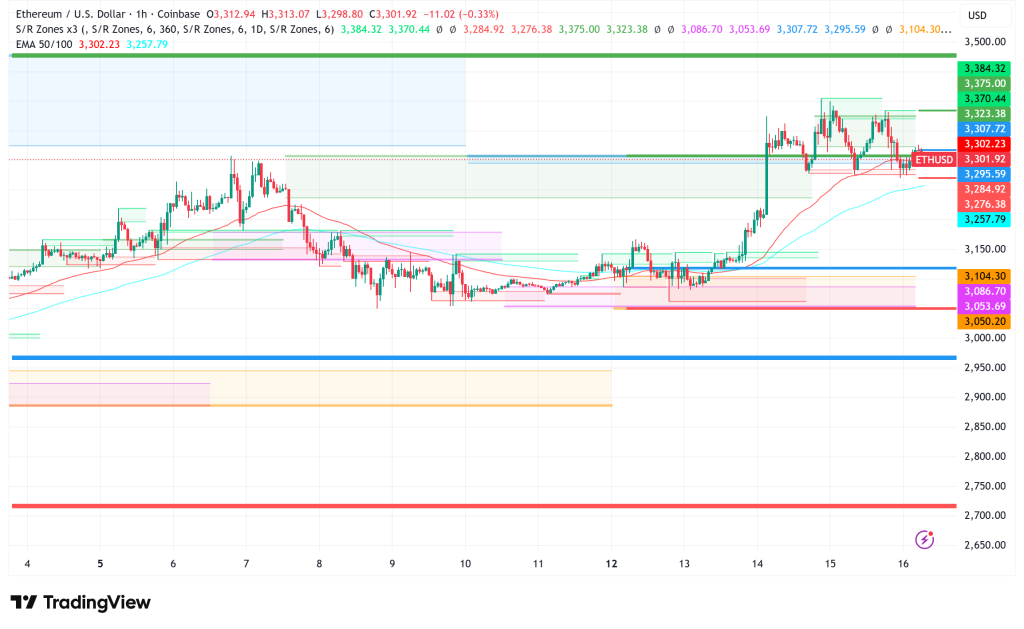
ETH/USD Technical Analysis: Critical Support Zone to Watch
A technical look at the daily chart shows that there is a key order block between $3,050 and $3,170 that emerged during Ethereum’s most recent upward push. This area lines up precisely with the Visible Range Volume Profile’s point of control, which is the price level where the most trading volume has happened since September 2025.
According to market structure theory, prices tend to return to these fair value zones before continuing greater trends. Hyblock data backs this up by showing that there are long positions worth more than $500 million between $3,040 and $3,100. This dense setup makes it more likely that there will be a short-term sweep into this region, which could provide the liquidity needed for a bigger continuing advance.
Long-Term Chart Points to $5,000 and Beyond
Merlijn, a technical analyst, looks at the monthly time frame. Since 2021, the Trader has seen a bullish pennant formation forming. In 2025, Ethereum briefly pushed through the upper limit of this pattern and got close to $5,000 before falling back. The way prices are moving right now makes it look like this breakthrough level will be tested again.
If the price breaks above $3,300 and stays there, it could go up to $3,600. The important $5,000 barrier is the key to new all-time highs. The bullish pennant forecast shows that goals might be as high as $8,400 in a multi-stage expansion that lasts until 2026. However, these advances would probably be very volatile and require retests along the way.
Ethereum Price Prediction: Strategic Dip Before Launch
Ethereum looks like it’s ready for a short-term drop toward the $3,050-$3,170 support zone based on a number of technical signs that are all pointing in the same direction. After that, it should rise toward $4,100. The high Leverage Ratio and concentrated long positions point to a fast correction, maybe even a wick driven by liquidation instead of long-term selling.
After this projected cleanup, historical patterns and bullish chart structures point to a rally toward $4,100 in the near future. The next big psychological and technical barrier is $5,000. Traders should be patient and wait for the best times to enter the market. They should also keep a watch on the larger cycle target of around $8,400 until late 2026.
- Check out our free forex signals
- Follow the top economic events on FX Leaders economic calendar
- Trade better, discover more Forex Trading Strategies
- Open a FREE Trading Account
- Read our latest reviews on: Avatrade, Exness, HFM and XM
Related Articles


Sidebar rates
Related Posts
