Silver Futures Near $95 as Gold’s $4,876 Breakout Keeps $100 in Play
Silver (XAG/USD) is hovering around $94.55, following gold's lead as it zooms past $4,876 - a direct result of investors fleeing...
Quick overview
- Silver (XAG/USD) is currently trading around $94.55, influenced by gold's rise and increasing geopolitical tensions.
- The relationship between gold and silver is significant, with traders often seeking silver exposure when gold reaches new highs.
- Silver remains in an ascending channel, indicating a strong bullish trend as long as it stays above $92.60.
- Momentum indicators suggest silver has potential for further gains, with key resistance levels at $96.70 and $100.75.
Silver (XAG/USD) is hovering around $94.55, following gold’s lead as it zooms past $4,876 – a direct result of investors fleeing to safe havens due to worsening geopolitical tensions and trade uncertainty. With Trump’s tariff threats flaring up again and the US dollar weakening under renewed pressure to ‘Sell America’, gold has taken the safe haven crown and silver is following with a slight delay, but is starting to gain traction.
This is a significant relationship. Whenever gold breaks into record territory, traders often find themselves looking for exposure to silver at lower price points. Right now, that dynamic is playing out again, all while markets wait with bated breath for US PCE inflation and GDP data – both of which could have a major impact on expectations of Fed policy and the dollar’s next move.
What the silver chart says after the recent upswing
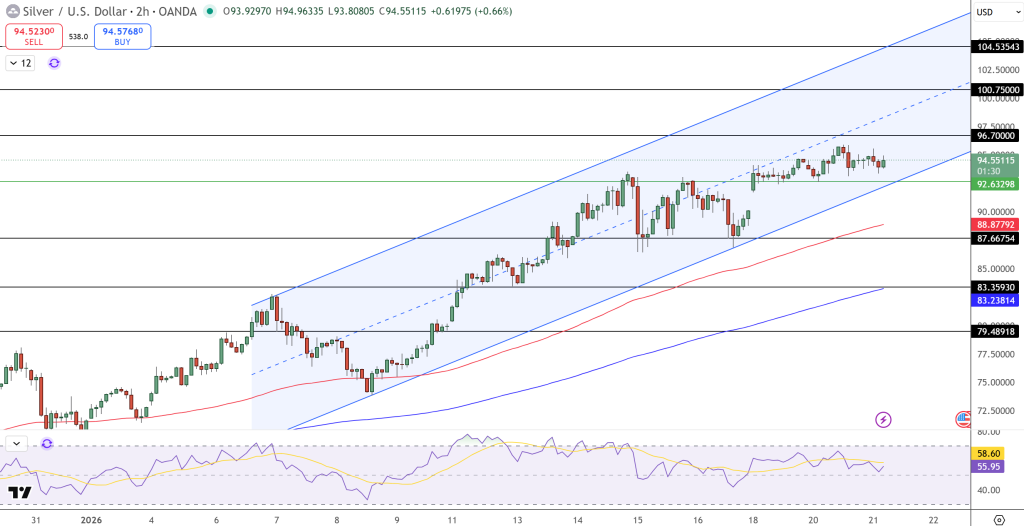
Looking at the 2-hour chart, silver remains snug inside a clear-cut ascending channel with price consolidating at the higher end of that channel. Don’t misread this as weakness – it’s just the market digesting a strong upswing. The shape of the candlesticks has shifted from large, bullish bodies to smaller ranges with mixed wicks – a sign of balance, not distribution.
[[XAG/USD-graph]]
The big picture trend is still very much in the silver bulls’ corner as long as the price stays above $92.60, which just so happens to be where previous support lies. Below that level, we’re looking at a critical zone between $88.90 and $87.65 – an area of horizontal demand and the 50-period moving average, which is pointing ever upwards.
Silver Price Forecast: How the current silver structure is a vote for the uptrend
Momentum is looking good for a continuation. The RSI is sitting pretty at 56 – right in neutral territory, in stark contrast to gold’s overbought readings. This means silver has room to head even higher without worrying about the sort of short-term exhaustion risk that gold is facing right now.
Upwards, there’s a level to watch at $96.70, which has been a selling zone in the past, and a break above that level would open the door to the all-important $100.75 area, especially if gold shoots up towards $4,950-$5,000 – an area we highlighted in recent gold forecasts.
Trade idea: Short-term buy gold on dips near $92.60, target $100.00, stop below $88.80.
- Check out our free forex signals
- Follow the top economic events on FX Leaders economic calendar
- Trade better, discover more Forex Trading Strategies
- Open a FREE Trading Account
- Read our latest reviews on: Avatrade, Exness, HFM and XM
Related Articles
Sidebar rates
Related Posts
