GBP/USD Eyes $1.36 After $1.35 Break—Is the Downtrend Finally Over?
GBP/USD is knocking on the door of $1.3520, and its rebound is looking like it's not going to be a half-hearted one...
Quick overview
- GBP/USD is approaching $1.3520, showing strong bullish momentum after defending the critical low of $1.3340.
- The pair has reclaimed the 50-period and 200-period EMAs, indicating a shift in trend favoring buyers.
- A break above the resistance zone of $1.3535-$1.3565 could lead to further gains towards $1.3600.
- Key support levels to watch are $1.3485 and $1.3445, with buying opportunities suggested near $1.3490.
GBP/USD is knocking on the door of $1.3520, and its rebound is looking like it’s not going to be a half-hearted one. After defending that critical low of $1.3340 on the 4 hour chart, it’s started to look like buyers are stepping up rather than waiting for things to get even worse. The recent candles are all pretty bullish with those super short lower wicks – a real sign that buyers are jumping in there early.
The fact that it’s now reclaimed both the 50-period and 200-period EMAs clustered around $1.3410-$1.3440, is a big deal too. That zone was basically the one that kept the price in check for all of January. Now, it’s all changed… the trend has clearly shifted in favour of the bulls.
Trendline Break Shifts the Technical Landscape
You might want to note the break above the trendline that’s been guiding price lower since January. That trendline effectively releases the thumbs screws, allowing GBP/USD to start exploring some higher levels without all that technical pressure.
Looking at it the other way around though… support and resistance wise, GBP/USD is coming up against some familiar opposition. The market has been defended by the sellers at $1.3535-$1.3565 on more than one occasion already, so now its poking its head up there once again. A clean break through there, and its onto $1.3600. Fail to do so, and it looks like its back to consolidation rather than a reversal.
If it does start to dip, the first thing it’ll probably touch is former resistance at $1.3485, now first up as a support followed by $1.3445 where its been picked up by the buyers on the way down.
GBP/USD Price Forecast: Momentum & Fib Levels Keep the Bias Constructive
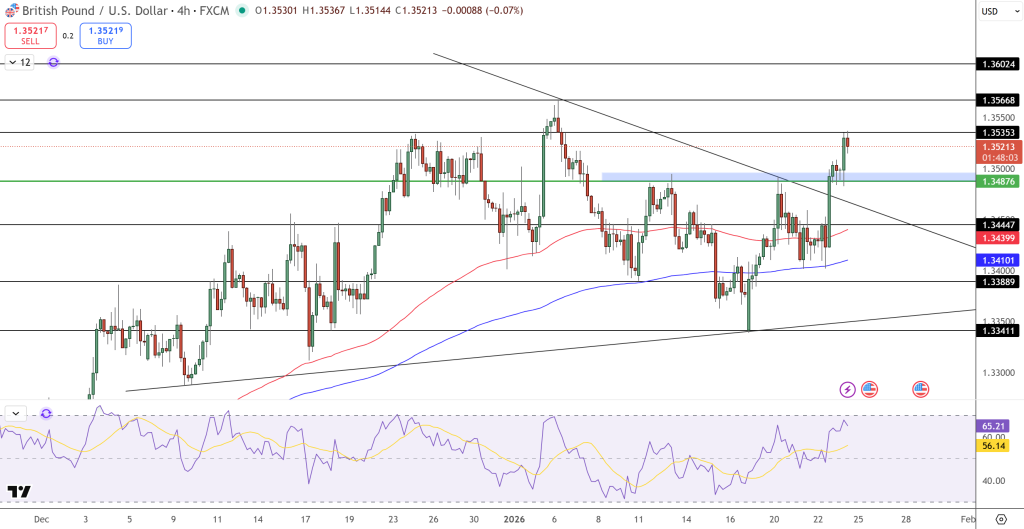
Now have a look at the Fibo retracement. GBP/USD is still holding on above the 50% retracement mark of that prior down swing, which kinda puts the boot in on the idea this move is just a weak little bounce. The momentum is with the bulls here.
The RSI is just a whisker above 65 and still rising – not yet getting into overdrive levels that suggest a pullback is due. As long as its holding above the midline, dips are more likely to be getting picked up by buyers rather than sellers.
Key levels to keep an eye on
- Resistance: $1.3535-$1.3565
- Support: $1.3485 then $1.3445
- Momentum: for as long as RSI is above 60, its pointing in a constructive direction
Trade idea: Buy dips near $1.3490 – aim for $1.3560. Stop below $1.3440.
- Check out our free forex signals
- Follow the top economic events on FX Leaders economic calendar
- Trade better, discover more Forex Trading Strategies
- Open a FREE Trading Account
- Read our latest reviews on: Avatrade, Exness, HFM and XM
Related Articles


Sidebar rates
Related Posts
