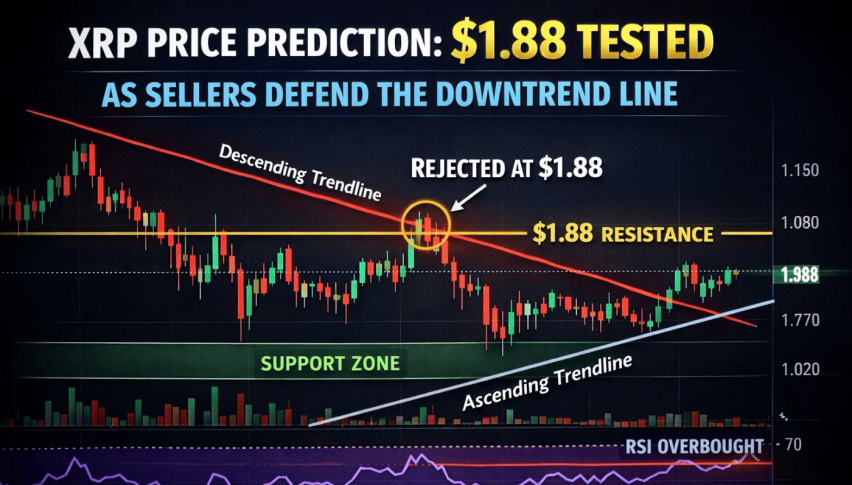
XRP Price Prediction: $1.88 Tested as Sellers Defend the Downtrend Line
XRP is trading near $1.88, attempting to stabilize after weeks of steady pressure from a clearly defined descending trendline...
Quick overview
- XRP is currently trading around $1.88, showing signs of stabilization after a period of downward pressure.
- The price action indicates that buyers are entering on dips, but recovery attempts are limited as XRP struggles to reclaim the 50-EMA.
- A bearish trend persists, with key resistance at $1.92–$1.95 and support levels at $1.80 and $1.73.
- Momentum indicators suggest caution, with the RSI near 40 indicating weakening demand without reaching oversold conditions.
XRP is trading near $1.88, attempting to stabilize after weeks of steady pressure from a clearly defined descending trendline on the 4-hour chart. Recent candles between $1.85 and $1.88 show long lower wicks and smaller real bodies, a classic sign that buyers are stepping in on dips rather than chasing higher prices. Still, recovery attempts remain limited, with XRP unable to reclaim the 50-EMA, keeping short-term control in sellers’ hands.
XRP/USD Technical Analysis: Bearish Structure Still Defines the Trend
From a broader perspective, XRP continues to print lower highs after failing near $2.35, forming a well-contained bearish channel. The decisive break below $2.01, a former horizontal support, marked a clear shift in momentum and turned that area into resistance.
For now, the $1.92–$1.95 zone acts as a ceiling for any bounce. Below current levels, attention turns to $1.80, a psychological and technical support. If that level gives way, downside risk extends toward $1.73, where prior demand previously slowed selling pressure.
XRP/USD Technical Analysis: Momentum Signals Caution, Not Panic
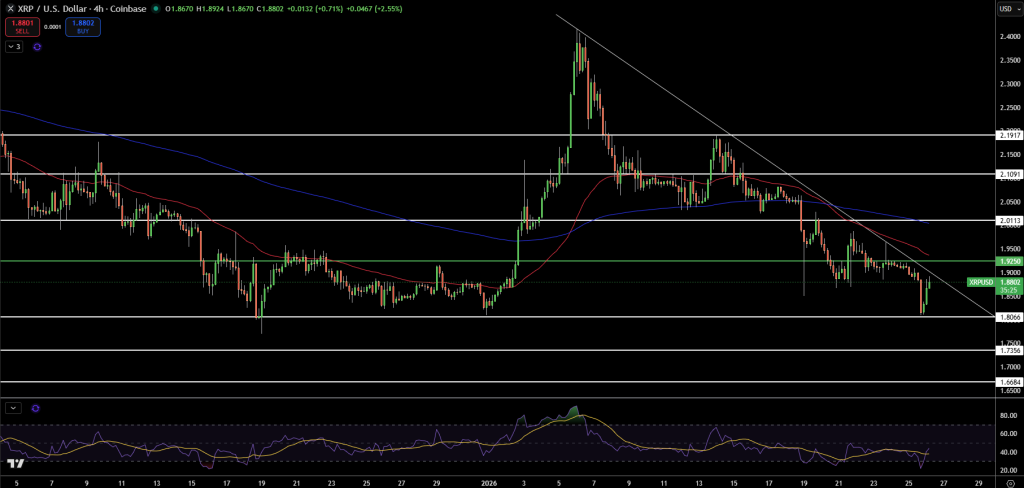
Momentum indicators reflect the same cautious tone. The RSI near 40 points to weakening demand but stops short of oversold territory. This suggests selling pressure is controlled rather than aggressive. A sustained break above the descending trendline and reclaim of the $2.01–$2.05 zone would be needed to meaningfully shift sentiment.
Key levels to watch
- Resistance: $1.92–$1.95, then $2.05
- Support: $1.80, followed by $1.73
- Trend bias: Bearish below the trendline
- Momentum: Weak, not oversold
Trade idea: Sell rallies near $1.95, target $1.80, stop above $2.05.
- Check out our free forex signals
- Follow the top economic events on FX Leaders economic calendar
- Trade better, discover more Forex Trading Strategies
- Open a FREE Trading Account
- Read our latest reviews on: Avatrade, Exness, HFM and XM
Related Articles


Sidebar rates
Related Posts
