Gold Price Forecast: Can XAU/USD Reclaim $5,146 as the $5,000 Floor Firms?
By mid-February 2026, gold prices have made a strong comeback, moving back above the key $5,000 per ounce level.
Quick overview
- By mid-February 2026, gold prices have rebounded above $5,000 per ounce after a volatile period.
- Spot gold is trading between $5,041 and $5,044, while April 2026 futures are near $5,046, indicating renewed market optimism.
- The surge in gold prices is attributed to cooling US inflation, continued central bank demand, and gold's appeal as a neutral asset amid geopolitical tensions.
- The outlook remains bullish for gold as long as it stays above the key support level of $4,950.
By mid-February 2026, gold prices have made a strong comeback, moving back above the key $5,000 per ounce level. After a volatile stretch with prices ranging from January’s record high of $5,600 to below $4,920, gold is regaining its appeal.
Market Snapshot: Spot and Futures Performance
At the start of the new trading week, the market shows renewed optimism:
- Spot Gold (XAU/USD) is trading between $5,041 and $5,044, up 2.5% from last week’s lows.
- Gold Futures (COMEX): April 2026 contracts (GCG26) have settled near $5,046, and open interest remains high as institutional investors return to the market.
Why Gold Surged Back: The Relief Rally Explained
The mid-February rebound was driven by a mix of economic data and changing market expectations.
1. Cooling US Inflation Signals
January’s CPI data showed annual inflation at 2.4% and core inflation at 2.5%. These lower-than-expected numbers have slowed the rise in Treasury yields and weakened the US Dollar. As a result, markets now expect the Federal Reserve to cut rates later in 2026.
2. Structural Central Bank Demand
Although central bank buying has slowed from the record 1,000-tonne years of 2022 to 2024, it still provides strong support. In 2026, net purchases are estimated at 800 tonnes, about 26% of yearly mine output.
Emerging markets such as Poland, China, and Turkey are continuing to reduce their reliance on the US Dollar as a strategy to protect against currency risks.
3. Geopolitical “Neutral Money” Appeal
As global divisions and trade tensions grow, gold’s role as a neutral asset is becoming more important. More portfolio managers are using gold to protect against rising government debt and economic uncertainty in major countries.
Technical Analysis: Key Levels for the Week Ahead
Gold’s technical outlook is still positive, even after the late-January speculative squeeze. The price is now well above the 50-day EMA ($4,947) and the 200-day EMA ($4,809).
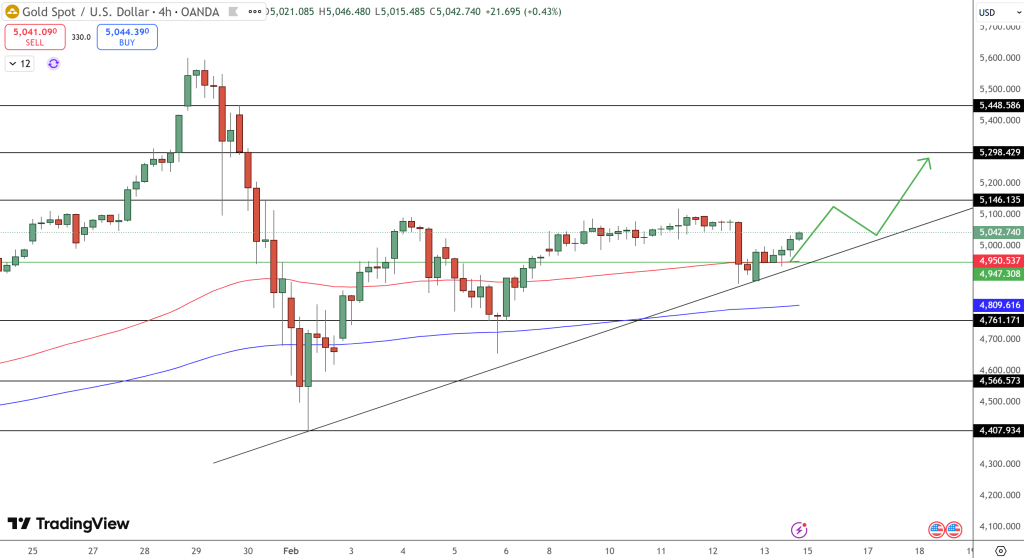
| Level Type | Price Point | Significance |
| Primary Resistance | $5,146 | A break above this confirms the end of the consolidation phase. |
| Secondary Resistance | $5,298 | Target for a bullish breakout toward new quarterly highs. |
| Key Support | $4,950 | The “Must-Hold” zone; serves as the new baseline for buyers. |
| Deep Support | $4,761 | The floor established during the late-January correction. |
The Verdict: Weekly Bias
For the week of February 16, 2026, the outlook is bullish as long as gold stays above $4,950.
Some short-term volatility is likely, especially with lower trading volumes during the Chinese Lunar New Year break (Feb 16 to 23). However, strong fundamentals like supply shortages and institutional demand mean any price drops should be limited.
Analyst Note: “The $5,000 mark isn’t just a number; it’s a psychological rebasing of the market. As long as gold holds this level, the path of least resistance is toward the $5,300 handle.”
- Check out our free forex signals
- Follow the top economic events on FX Leaders economic calendar
- Trade better, discover more Forex Trading Strategies
- Open a FREE Trading Account
- Read our latest reviews on: Avatrade, Exness, HFM and XM
Related Articles

Sidebar rates
Related Posts
