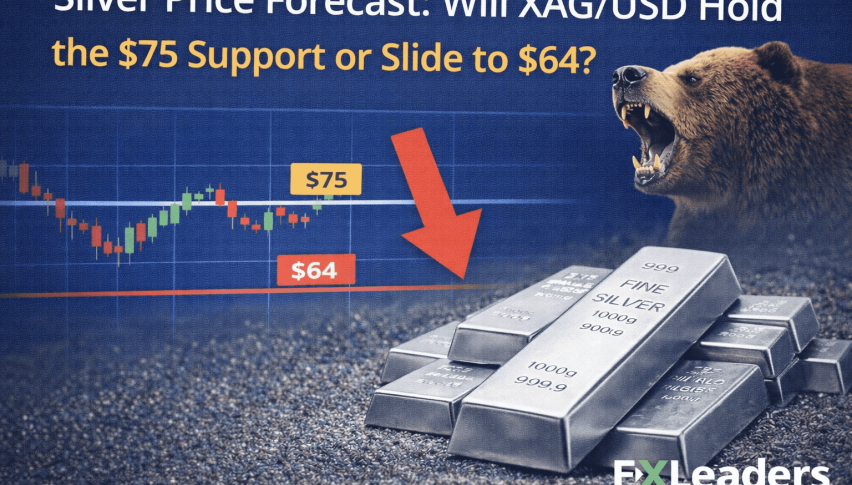
Silver Price Forecast: Will XAG/USD Hold the $75 Support or Slide to $64?
After an explosive start to 2026 that saw the white metal breach $120 per ounce and drive the gold-to-silver ratio below 50...
Quick overview
- Silver has experienced a significant correction after a strong start to 2026, with a 20% slump in mid-February.
- Major institutions like J.P. Morgan forecast an average silver price of $81 per ounce for 2026, despite ongoing supply deficits.
- The silver market faces opposing trends in industrial demand, with increased thrifting in the solar sector and rising demand from AI-driven applications.
- Technically, silver remains bearish below $79.42, with critical support at $74.18 and a major buy zone around $64.06.
Silver is currently the “wild child” of the precious metals complex. After an explosive start to 2026 that saw the white metal breach $120 per ounce and drive the gold-to-silver ratio below 50, a brutal correction has taken hold.
As of mid-February, silver is grappling with a 20% monthly slump, leaving investors to wonder if this is a healthy reset or the beginning of a deeper “liquidation event.”
Market Snapshot: Volatility Amid Holiday Silence
Trading volumes are low today because of U.S. Presidents’ Day and China’s Lunar New Year holidays, but market uncertainty remains elevated.
- Live spot silver is trading between $75.80 and $76.60, down approximately 1.5% today.
- On February 12, silver declined by more than 11%, primarily due to broad cross-asset liquidation and algorithmic stop-hunting.
- The gold-to-silver ratio is near 64:1, rebounding from a 15-year low as silver underperforms gold in the current risk-off environment.
Fundamental Pillars: The $81 Average Forecast
Despite recent sharp declines, major institutions such as J.P. Morgan maintain an average price forecast of $81 per ounce for 2026, citing persistent structural deficits.
1. The Sixth Consecutive Deficit
The silver market is expected to experience its sixth consecutive year of supply shortfall in 2026, with a projected deficit of 67 million ounces. Since 2021, cumulative deficits have surpassed 800 million ounces, equivalent to a full year of global mine production.
2. Industrial “Thrifting” vs. AI Growth
In 2026, industrial demand for silver is shaped by two opposing trends:
- Bearish outlook: Elevated prices have led to increased thrifting in the solar sector, with manufacturers seeking silver-free alternatives to reduce costs.
- Bullish outlook: AI-driven data centers and high-efficiency electronics are creating significant new demand, as these applications require silver for its superior conductivity in high-load thermal management.
3. The “Warsh Shock” and Fed Policy
The nomination of Kevin Warsh as Federal Reserve Chair in late January led to a 27% decline in silver prices as markets anticipated a stronger dollar. However, lower January CPI data at 2.4% has renewed expectations for a June rate cut, offering support for silver.
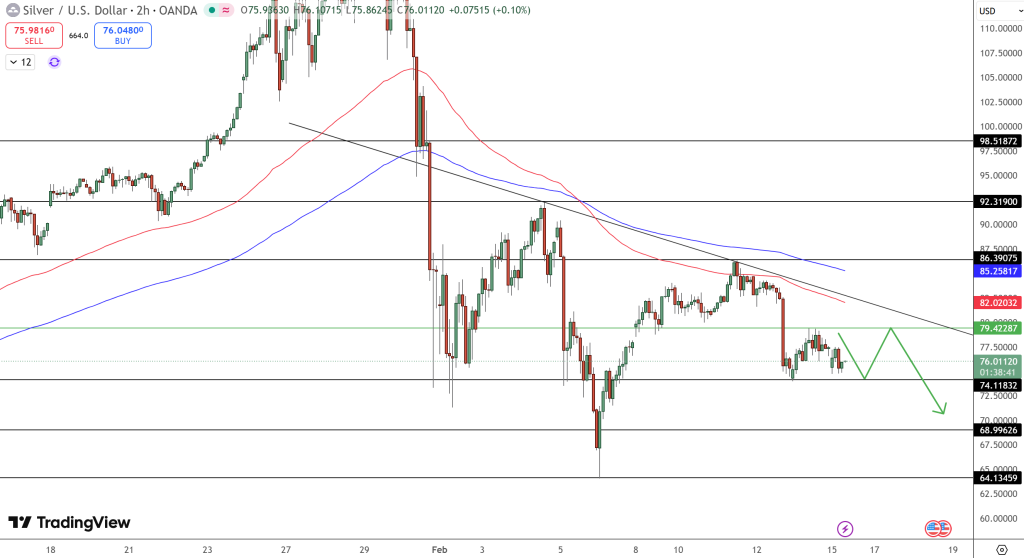
Silver (XAG/USD) Technical Analysis: Trapped Under the Trendline
Technically, XAG/USD remains below a descending trendline that has influenced price action for the past three weeks.
| Level Type | Price Point | Technical Outlook |
| Crucial Resistance | $79.42 | The “Pivot Point.” Silver must break this to stop the bearish bleed. |
| Descending 50-EMA | $82.02 | This level acts as the ceiling for any relief rallies. |
| Immediate Support | $74.18 | The mid-February swing low; a close below this is a “danger signal.” |
| Major “Buy” Zone | $64.06 | The top of the multi-year rising channel and the critical structural floor. |
The Verdict: Weekly Bias
The outlook for the week of February 16, 2026, is Bearish below $79.42. Traders should exercise extreme caution; while the $75 support is being defended, the “lower high” structure remains intact. A failure to reclaim $80 early in the week could see a rapid flush toward the $64–$69 region.
Conversely, a breakout above the trendline would signal that the “forced liquidation” phase is over.
Analyst Note: “Silver is currently hunting for a bottom. While industrial demand is the long-term anchor, the short-term chart belongs to the bears until we see a sustained close above the 50-EMA.”
- Check out our free forex signals
- Follow the top economic events on FX Leaders economic calendar
- Trade better, discover more Forex Trading Strategies
- Open a FREE Trading Account
- Read our latest reviews on: Avatrade, Exness, HFM and XM