Bitcoin Stabilizes at $66,000: Rare On-Chain Bottom Signal Flashes Amid Looming Liquidity Inflection
Following a turbulent start to the month, Bitcoin (BTC) is currently exhibiting indications of stability as it holds stable near $66,000.
Quick overview
- Bitcoin is currently stable near $66,000, despite a 47% drop from its peak in October 2025.
- The Short-Term Holder Bollinger Band oscillator indicates extreme oversold conditions, reminiscent of the 2018 market crash.
- Keyrock's report suggests that U.S. Treasury bill issuance is now a more significant driver of Bitcoin prices than Federal Reserve policies.
- Technical analysis shows critical price levels, with $70,000 as major resistance and $52,000 as a potential bear case target.
Following a turbulent start to the month, Bitcoin BTC/USD is currently exhibiting indications of stability as it holds stable near $66,000. Even if the asset has dropped around 47% from its peak of $126,270 in October 2025, a number of severe on-chain metrics and impending fiscal events indicate that the market might be on the verge of a solid cycle bottom.
The 2018 Bottom Signal: Short-Term Holder Capitulation
A crucial on-chain statistic is displaying a signal that hasn’t been seen since the market crash in 2018. It has reached its deepest oversold territory in almost eight years, according to the Short-Term Holder (STH) Bollinger Band oscillator, which tracks the difference between the spot price of Bitcoin and the average cost basis of wallets holding for fewer than 155 days.
In the past, it has been a hint that recent buyers have given up and sold at a large loss when the spot price breaks through the bottom statistical zone of this parameter. This precise “extreme stress” print came before a 700% increase following the November 2022 lows and a 1,900% rise throughout the three years after the 2018 bottom. Although the current price action appears to be stationary, Checkonchain analysts point out that this “seller exhaustion” is typical with macro bottoms.
The Keyrock Report: Treasury Bills, Not the Fed, Now Drive BTC Price
An innovative study from a cryptocurrency market maker The conventional wisdom that the Federal Reserve’s interest rate policy is the main factor influencing the price of Bitcoin has been called into question by Keyrock. Rather, the study finds that the most important measure of liquidity is the issuance of U.S. Treasury bills (T-bills), which have had an 80% association with Bitcoin prices since 2021.
- The Leading Indicator: T-bill issuance historically leads Bitcoin price movements by approximately eight months.
- The 7.6% Rule: Every 1% change in global liquidity impacts BTC’s price by 7.6% in the following business quarter.
- Refinancing Tailwind: With a massive $38 trillion in U.S. debt maturing over the next four years, the Treasury is expected to ramp up T-bill issuance to $600 billion–$800 billion annually. Keyrock forecasts that this fiscal “inflection point” will create a massive liquidity tailwind for Bitcoin in late 2026.
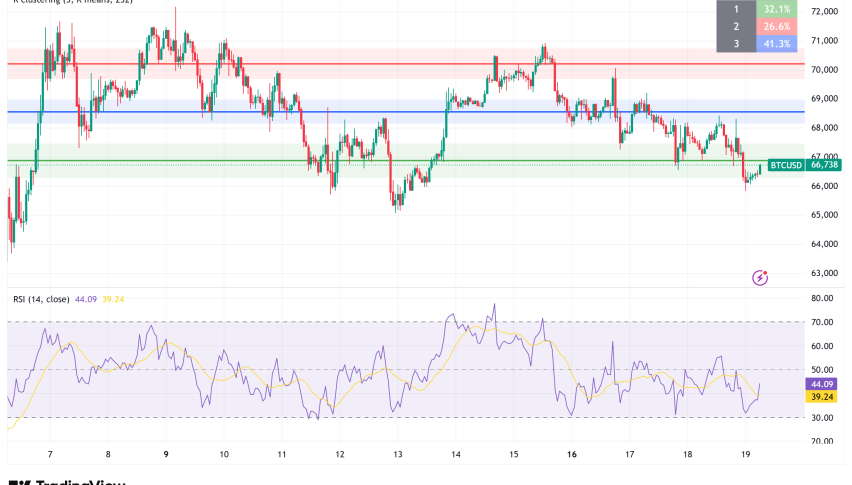
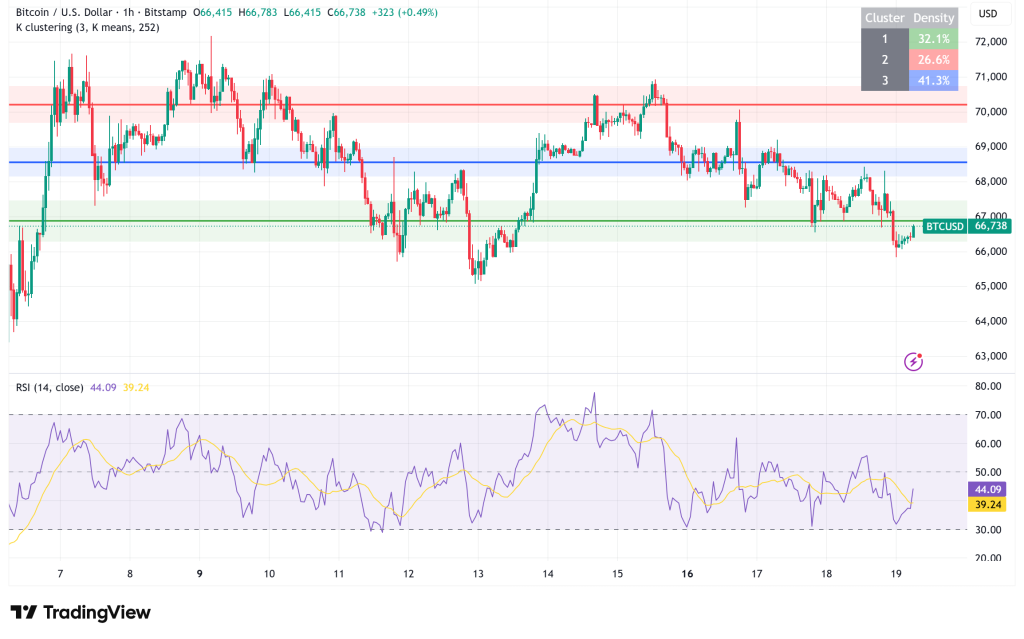
BTC/USD Technical Analysis: $52,000 or $70,000 Next Target?
The short-term technicals are still protective in spite of the long-term positive signs. According to Glassnode data, investors who made purchases during the H1 2024 consolidation primarily created the “dense demand zone” between $60,000 and $69,000.
- $70,000 (Major Resistance): Reclaiming this level is considered essential to reset the overarching bullish trend.
- $66,000 (Consolidation Floor): This serves as the current pivot point; price action has remained range-bound at this level for the past 10 days.
- $60,000 (Critical Support): A decisive breakdown below this mark could trigger a “liquidity flush,” pushing prices toward lower macro targets.
- $52,000 (Bear Case Target): This has become a popular target for traders anticipating one final capitulation move within the next week.
Bitcoin Price Prediction: A Near-Term Rebound?
A fresh catalyst might appear sooner, even though some traders, like Roman, predict a quick decline to $52,000 to “reset” indicators like the RSI and MACD. Ohsung Kwon, a strategist at Wells Fargo, recently pointed out that by the end of March 2026, the “YOLO trade” would be revived by larger-than-normal U.S. tax refunds, which might amount to as much as $150 billion.
The current oversold on-chain signals and this liquidity injection could prevent a more severe meltdown and instead lead to a gradual rebound toward the $80,000 “True Market Mean” by the middle of the year.
- Check out our free forex signals
- Follow the top economic events on FX Leaders economic calendar
- Trade better, discover more Forex Trading Strategies
- Open a FREE Trading Account
- Read our latest reviews on: Avatrade, Exness, HFM and XM
Related Articles
Sidebar rates
Related Posts
