btc-usd
Forex Signals Feb 19: Walmart (WMT), Alibaba, Gold Fields, Rio Tinto Earnings Preview
Large companies in the retail, e-commerce, and global mining industries are releasing their earnings today, including Walmart Inc., Alibaba
•
Last updated: Thursday, February 19, 2026

Quick overview
- Major companies like Walmart, Alibaba, Rio Tinto, and Gold Fields are reporting earnings today, reflecting diverse sectors including retail and mining.
- The U.S. dollar strengthened due to rising Treasury yields and positive economic data, despite a slight decline in durable goods orders.
- FOMC minutes indicated a hawkish stance, with policymakers showing caution about easing rates amid inflation concerns.
- Market reactions to earnings reports will focus on forward guidance, particularly regarding consumer spending and commodity demand.
Live BTC/USD Chart
BTC/USD

0.0000
MARKETS TREND
Large companies in the retail, e-commerce, and global mining industries are releasing their earnings today, including Walmart Inc., Alibaba Group Holding Limited, Rio Tinto Group, and Gold Fields Limited.
USD Strength Backed by Yields and Data
The U.S. dollar moved broadly higher yesterday, supported by a steady rise in Treasury yields and a series of better-than-expected economic releases. Momentum built throughout the session as investors digested fresh data alongside the latest FOMC minutes, reinforcing expectations that U.S. monetary policy will remain restrictive for longer.
December durable goods orders declined 1.4%, but the drop was less severe than the expected 2.0% contraction. Broader data painted a firmer picture. Housing starts and building permits improved, industrial production rose 0.7% versus 0.4% expected, and manufacturing output climbed 0.6%, also beating forecasts. Collectively, the data suggested economic resilience despite tighter financial conditions.
FOMC Minutes Reinforce Hawkish Tone
The January FOMC minutes leaned hawkish overall. While two officials dissented in favor of a 25-basis-point rate cut, most participants supported holding rates steady at 3.5%–3.75%. The minutes emphasized caution, with policymakers signaling little urgency to ease.
Officials acknowledged the possibility of “two-sided” policy guidance, meaning rates could move in either direction if inflation progress stalls. Inflation forecasts were nudged slightly higher, and staff projections showed GDP running above potential growth through 2028. Policymakers warned that the path back to 2% inflation may be slower and more uneven, reinforcing the “higher for longer” narrative.
Adding to inflation concerns, crude oil surged $2.90 (+4.66%) to $65.22, its largest Monday gain since June 17, amid escalating geopolitical tensions involving Iran.
Yields Climb, Equities Advance
Treasury yields rose across the curve, with the 10-year reaching 4.0865%. Despite higher yields, equities extended gains. The Dow rose 0.28%, the S&P 500 advanced 0.56%, and the Nasdaq gained 0.70%, marking its second consecutive positive session.
Key Market Events to Watch Today:
Today’s earnings lineup spans defensive retail, Chinese technology, and global mining—offering a broad read on consumer health, commodity demand, and global economic momentum. Walmart may provide insight into U.S. spending resilience, Alibaba into China’s recovery trajectory, while Rio Tinto and Gold Fields will reflect trends in industrial metals and precious commodities.
🛒 Walmart Inc. (WMT) – Q4 2026 (BMO)
- Reporting before market open (BMO).
- Consensus EPS estimate: $0.73.
- Market capitalization: approximately $1.01 trillion.
Investors will focus on:
- U.S. consumer spending trends.
- Grocery versus discretionary sales mix.
- Margin resilience amid wage and logistics pressures.
- Forward guidance in a potentially slowing economic environment.
Key question: Can Walmart sustain earnings momentum while managing cost pressures and competitive pricing?
🛍️ Alibaba Group Holding Limited (BABA) – December 2025 Quarter
- Market capitalization: approximately $358.9 billion.
- Consensus EPS estimate: $1.73.
- Prior-year EPS: $2.77, implying expected year-over-year decline.
- Earnings date: February 20, 2025 (December quarter results).
Focus areas:
- China consumer demand recovery.
- Cloud business performance.
- Margins amid restructuring and competitive pressure.
- Capital allocation and shareholder returns.
- The lower EPS expectation signals cautious sentiment around growth and profitability trends.
⛏️ Rio Tinto Group (RIO) – H2 2025 (BMO)
- Reporting before market open (BMO).
- Market capitalization: approximately $197.5 billion.
Key drivers:
- Iron ore pricing and shipment volumes.
- Cost discipline across operations.
- Capital expenditure plans.
- Dividend outlook.
- Commodity price volatility and China demand remain central themes.
🏅 Gold Fields Limited (GFI) – H2 2025 (BMO)
- Reporting before market open (BMO).
- Market capitalization: approximately $47.1 billion.
Key focus:
- Gold production levels.
- All-in sustaining costs (AISC).
- Impact of gold price fluctuations.
- Balance sheet strength and project pipeline updates.
- With gold prices sensitive to rate expectations and geopolitical risk, guidance will be closely watched.
Given macro uncertainty and valuation sensitivity across sectors, forward guidance could matter more than headline earnings beats. Market reaction is likely to hinge not only on results, but on management confidence about demand, margins and capital discipline in the quarters ahead.
Gold Resumes the Decline Again As Safe Havens Lose Status
Although demand for safe haven assets is still high, gold fell precipitously from record highs following the Fed’s most recent rate cut comments, as profit-taking was prompted by Powell’s cautious tone. In December, gold jumped above $4.3800 following the Federal Reserve’s announcement of a 25 basis point rate decrease. But the impetus soon waned, and prices dropped back to $4,004. The 20 daily SMA (gray) held as support last week and buyers returned and pushed XAU above the $5,000 mark for the first time during Asian hours and extended the rally in New York, printing a fresh record high near $5,111 before retreating below $5,000 late in the session. But buyers returned and XAU climbed to $5,598 but pulled back below $5,000 again.
USD/JPY Returns Back Down
Foreign exchange markets saw sharp swings. Early in the week, U.S. yield differentials and Japanese capital outflows pushed the dollar above ¥150, but disappointing U.S. jobs data triggered profit-taking, causing the USD/JPY to slide by four yen from its peak. However, the new BOJ governor the JPY has weakened and USD/JPY soared to 154 and we decided to close our buy signal for more than 80 pips as the pair found support at the 20 daily SMA (gray) and has rebounded more than 200 pips off that MA but reversed after the 25 bps rate cut from the FED. The price approached $160 but reversed after the BOJ meeting and fell 8 cents but found support at $152 at the 100 daily SMA (red) and rebounded above 156 but have reversed down again this week after the Japanese elections.
USD/JPY – Daily Chart
Cryptocurrency Update
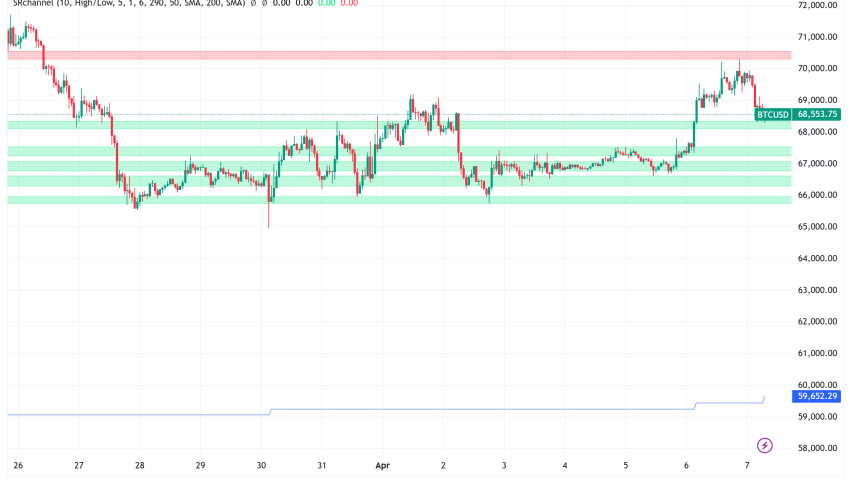
Bitcoin Returns Under $70K
Cryptocurrencies remained highly active over the summer. Bitcoin (BTC) climbed to fresh highs of $123,000 and $124,000 in July and August, supported by institutional inflows and technical strength. However, remarks from Treasury Secretary Scott Bessent ruling out U.S. increases to BTC reserves triggered a steep pullback, sending the coin down to $80K before finding support at the 100 weekly SMA (green). A rebound followed, sending BTC near $100 is the first major text for Bitcoin buyers. However BTC returned lower and fell below $80K, breaking below the but the 100 weekly SMA (green) but the decline stopped at the $60K support where the 200 weekly SM A(purpe) stands and rebounded above $70K.
BTC/USD – Weekly Chart
Ethereum Slips Below $2,000
Ethereum (ETH) has been similarly strong, surging toward $4,800, its highest since 2021 and near its all-time peak of $4,860. Despite a dip last week, ETH found support at the 20-day SMA, with retail enthusiasm and renewed institutional participation driving fresh upside momentum. Last week we saw a dive below $2,000 but buyers returned n d pushed the price above $2K again.
ETH/USD – Weekly Chart
- Check out our free forex signals
- Follow the top economic events on FX Leaders economic calendar
- Trade better, discover more Forex Trading Strategies
- Open a FREE Trading Account
- Read our latest reviews on: Avatrade, Exness, HFM and XM
ABOUT THE AUTHOR
See More
Skerdian Meta
Lead Analyst
Skerdian Meta Lead Analyst.
Skerdian is a professional Forex trader and a market analyst. He has been actively engaged in market analysis for the past 11 years. Before becoming our head analyst, Skerdian served as a trader and market analyst in Saxo Bank's local branch, Aksioner. Skerdian specialized in experimenting with developing models and hands-on trading. Skerdian has a masters degree in finance and investment.
Related Articles

11 minutes ago
Save
Sidebar rates
Related Posts
