CRDO Stock Skyrockets 2,870% — Inside Credo Technology Group’s Explosive Rally

Quick overview
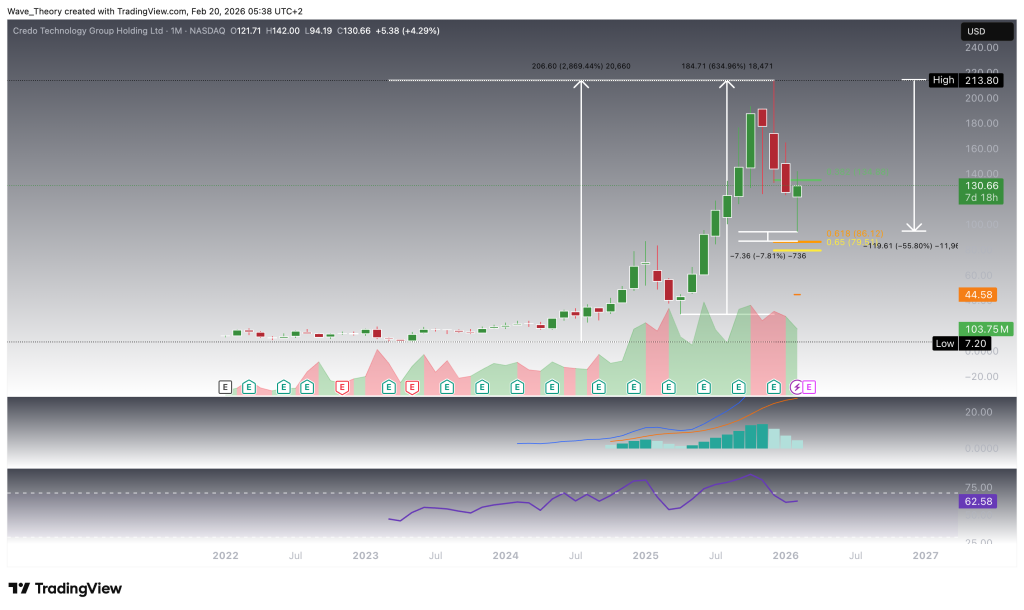
- Credo Technology Group (CRDO) has surged approximately 635% since April, reaching an all-time high near $214 before entering a corrective phase.
- The stock is currently facing significant resistance at the 0.382 Fibonacci level around $140, which it must break to maintain bullish momentum.
- Despite recent bearish signals on shorter timeframes, the overall trend remains bullish, supported by higher timeframe indicators.
- Key support levels to watch include $117 (50-week EMA) and $80 (0.618 Fibonacci), which could define the structural floor of the current correction.
CRDO Stock Faces Major Resistance at the 0.382 Fibonacci Level at $140
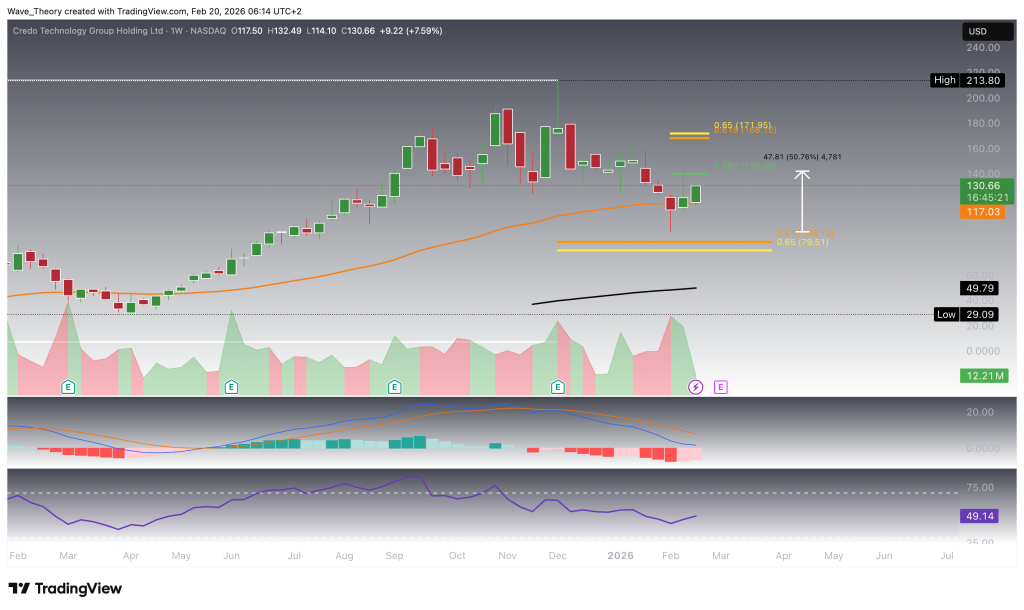
At approximately $140, CRDO encountered a clear rejection last month after advancing roughly 51% over an eight-week period, highlighting the significance of the 0.382 Fibonacci retracement as a key overhead resistance. This reaction underscores the presence of supply in that region following the recent corrective rebound.
Despite this bearish rejection, the stock has demonstrated notable resilience by holding above the 50-week EMA support at $117, preserving its medium-term bullish structure and preventing a breakdown into deeper retracement territory. From a technical standpoint, this successful defense of dynamic support keeps the possibility of continued upside attempts firmly intact.
Looking ahead, CRDO may be poised for another test of the $140 resistance level. A confirmed bullish breakout above the 0.382 Fibonacci barrier would likely trigger further upside momentum, opening the path toward the golden ratio (0.618 Fibonacci) resistance near $172.
A decisive break above this critical golden ratio level would be pivotal, as it would invalidate the current corrective phase and signal a transition back into a broader bullish continuation. In that scenario, the stock would have a high probability of retesting its all-time high near $214, with the potential to extend into new highs beyond that level.
Predominantly Bullish Signals on the Daily Chart of Credo Technology Group Stock
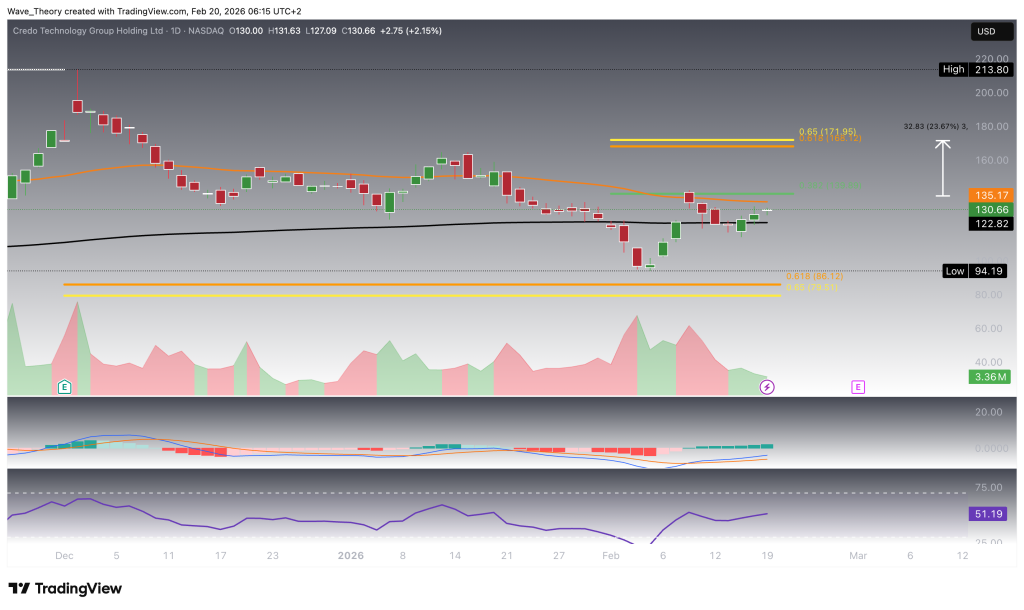
On the daily timeframe, CRDO is exhibiting predominantly bullish signals. The EMAs have formed a golden crossover, confirming a positive trend structure in the short- to medium-term horizon and indicating strengthening upside momentum. In addition, the MACD lines are bullishly crossed, while the MACD histogram has been ticking higher for several consecutive days, reinforcing the view of building bullish momentum.
At the same time, the RSI remains in neutral territory, providing neither a clear bullish nor bearish signal and suggesting that the stock is not yet in overbought conditions, leaving room for further upside expansion.
From a price action perspective, CRDO is currently encountering a significant resistance cluster between the 50-day EMA at $135 and the 0.382 Fibonacci level at $140. This zone represents a key technical barrier in the near term. A confirmed breakout above this confluence area could act as a catalyst for a continuation move toward the golden ratio (0.618 Fibonacci) resistance near $170, implying approximately 24% upside potential from the $140 level.
Death Cross on the 4H Chart — Short-Term Bearish Pressure Within Broader Structure
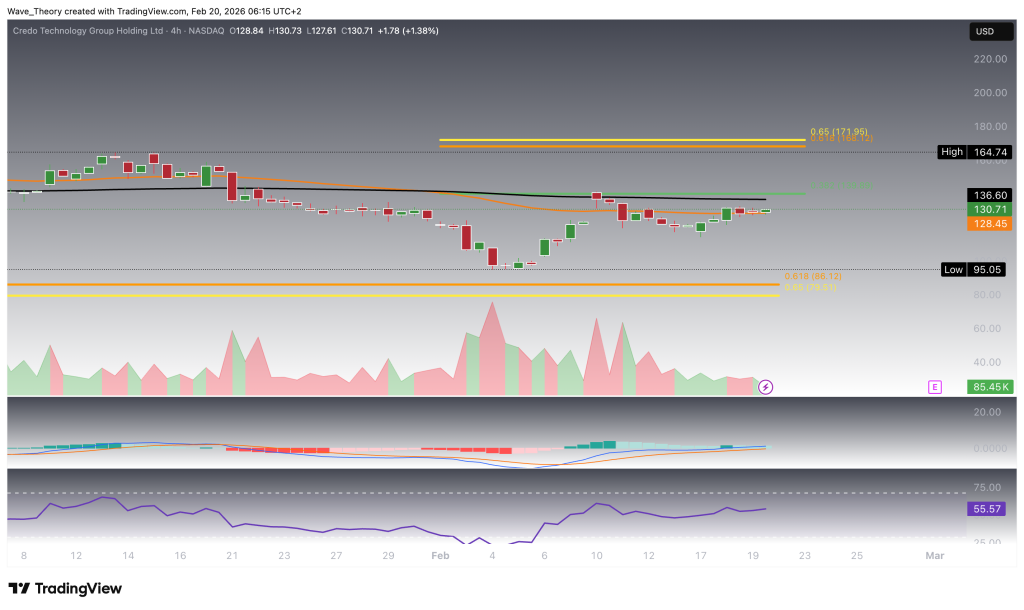
On the 4-hour timeframe, CRDO is displaying short-term weakness, as the EMAs have formed a death cross, confirming a bearish trend bias in the immediate horizon. This shift reflects a loss of short-term momentum following the recent rebound and signals increasing downside risk on lower timeframes.
Momentum indicators further support this view. The MACD histogram has been ticking bearishly lower, indicating fading bullish momentum. However, the MACD lines remain bullishly crossed, suggesting that the bearish pressure is still in its early stages and not yet fully confirmed as a sustained trend reversal. Meanwhile, the RSI continues to move in neutral territory, offering no clear directional signal and reflecting a balance between buying and selling pressure.
From a price action perspective, CRDO is currently facing a significant resistance zone between the 200-period EMA on the 4-hour chart at $136.6 and the 0.382 Fibonacci level at $140. This confluence area represents a key barrier for bullish continuation in the short term.
Should the stock face another rejection at this resistance cluster, the probability of a deeper retracement increases. In such a scenario, CRDO could extend its correction toward the critical golden ratio (0.618 Fibonacci) support near $80, which remains the key downside level to watch within the broader structure.
CRDO Stock Outlook — Key Levels to Watch
Credo Technology Group (CRDO) remains in a broader bullish structure following its multi-year rally from $7.20 to ~$214, despite undergoing a significant corrective phase over the past four months. While higher timeframes still support a continuation scenario, lower timeframes reflect ongoing consolidation and short-term uncertainty.
Bullish Scenario:
A confirmed breakout above the key resistance zone between $135 (50-day EMA) and $140 (0.382 Fibonacci) would likely trigger further upside momentum. The next major target lies at the golden ratio resistance near $170–$172, representing a critical level to invalidate the correction. A sustained break above this zone would open the path for a retest of the all-time high at ~$214 and potentially new highs.
Bearish Scenario:
Failure to break the $140 resistance zone, particularly if accompanied by rejection on lower timeframes, could lead to renewed downside pressure. In that case, the stock may revisit deeper support levels, with the most critical being the golden ratio support near $80, which defines the structural floor of the current correction.
Key Levels:
- Resistance: $135 (50-day EMA), $140 (0.382 Fib), $170–$172 (0.618 Fib)
- Support: $117 (50-week EMA), $80 (0.618 Fib)
Overall, the macro trend remains constructive, but CRDO must reclaim the $140–$172 resistance range to confirm a continuation of its long-term bullish trajectory.
- Check out our free forex signals
- Follow the top economic events on FX Leaders economic calendar
- Trade better, discover more Forex Trading Strategies
- Open a FREE Trading Account
- Read our latest reviews on: Avatrade, Exness, HFM and XM