Ethereum Reclaims $2,000 as Macro Winds Shift: Is the Whale Bottom In?
Ethereum (ETH) has risen 1.7% over the last day to trade at $2,009, indicating a strong comeback. Technical experts and on-chain specialists
Quick overview
- Ethereum has risen 1.7% to $2,009, showing a strong comeback while maintaining a 93% correlation with the S&P 500.
- On-chain data suggests a cycle bottom for Ether, as whale unrealized profit ratios have turned negative, indicating potential stabilization.
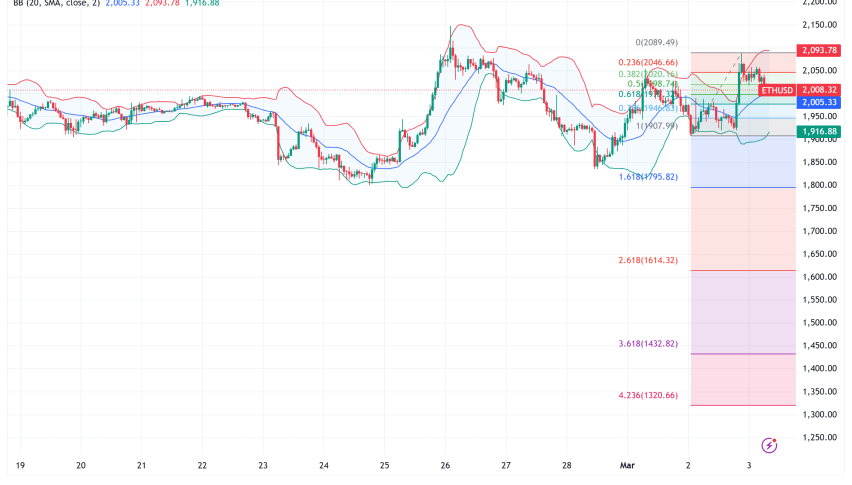
- Technically, Ethereum is cautiously bullish, aiming for the 61.8% Fibonacci level at $2,025, with support at $1,970.
- The short-term outlook suggests a potential breakout toward $2,120–$2,220, contingent on macro liquidity and market conditions.
Ethereum ETH/USD has risen 1.7% over the last day to trade at $2,009, indicating a strong comeback. Technical experts and on-chain specialists are closely examining Ether’s ability to maintain the psychological $2,000 level, even as the overall market is still vulnerable to global tensions. With ETH continuing to retain an astounding 93% correlation with the S&P 500, the current rise seems to be a classic “macro-beta” trade, indicating that Ethereum is among the first to catch the bid as global risk appetite flickers back to life.
On-Chain Signal: Ether Whales in the Red
Deeper on-chain data indicates that we might be seeing a cycle bottom rather than a structural collapse, despite the “Ethereum price crash” tales that dominated headlines earlier this week. Analytics reveal that whale unrealized profit ratios have gone negative for addresses with 1,000–10,000 ETH.
Large-scale holders typically indicate the last exhaustion stage of a correction when they move “underwater” in relation to their cost basis. Both the 2022 capitulation and the 2018 macro bottoms showed comparable readings. When in a losing position, large holders never sell violently; instead, this data point frequently follows a “strong hand” stabilizing phase where long-term conviction absorbs volatility.
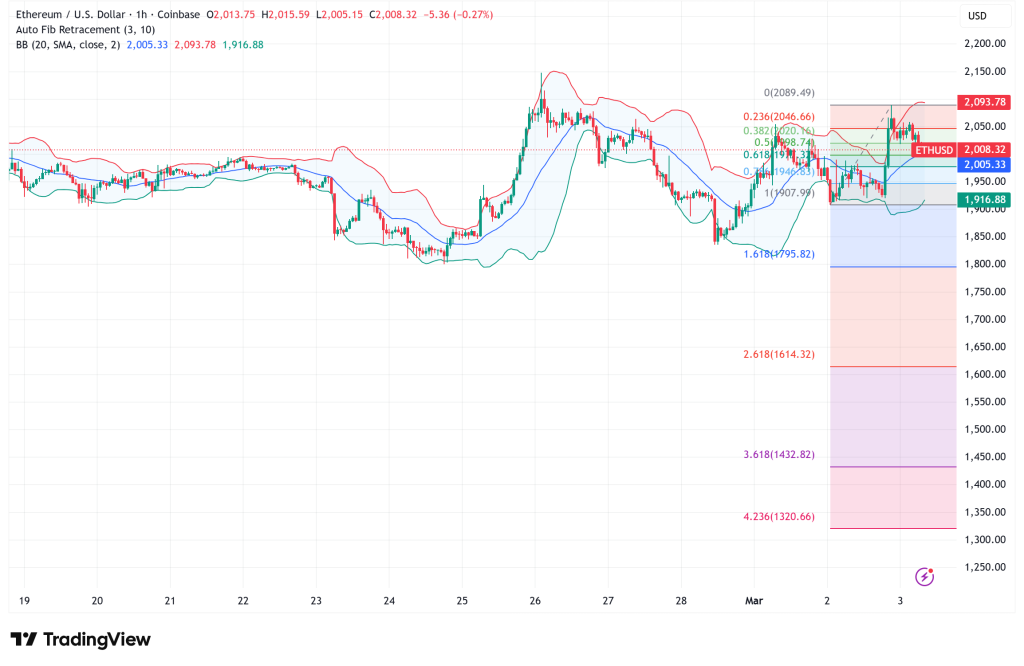
ETH/USD Technical Analysis: The Battle for the 61.8% Fibonacci Level
The current price movement of Ethereum is following a “cautiously bullish” trajectory. The asset has effectively turned previous resistance into a fundamental support zone by regaining its 7-day Simple Moving Average (SMA) around $1,970.
- The Bullish Path: On the hourly charts, ETH is presently moving through a rising channel. The 61.8% Fibonacci retracement level at $2,025 is the bulls’ immediate aim. A “liquidity grab” toward $2,080 and ultimately a retest of the $2,150 resistance zone could result from a clear break over this obstacle.
- The Bearish Risk: If the $2,080 zone is not cleared, the channel support at $1,960 may be retested. The “crash” narrative may worsen and expose the asset to deeper demand zones close to $1,750 if the macro-driven advance falters and ETH falls below $1,900.
Five-Year Structural Support Holds Firm
Ethereum’s engagement with its five-year macro trendline is arguably the most significant technical development. ETH has not made an impulsive break below this long-term structural floor, despite the recent turbulence. Rather, the price is precisely above the trendline and “compressing”—a word used to describe tightening consolidation.
Technically speaking, an explosive move frequently starts with compression at the structural support. The overall upward trend is sustained as long as the monthly close stays above this line. The ultimate “all-clear” signal would be regaining the $2,200 mark, which would change the short-term momentum from defensive to offensive.
Ethereum Price Prediction: Recovery or Range-Bound?
The path of least resistance for Ethereum now seems to be higher due to the 21% increase in trading volume and a positive flip in the MACD histogram.
Short-Term Outlook (1-2 Weeks): Ethereum is probably going to try to break out toward $2,120–$2,220 if the S&P 500 stays steady. However, the asset will continue to be dependent on macro liquidity due to the absence of an ETH-specific catalyst. Prior to a clear directional breakout, investors could anticipate turbulent consolidation in the $1,960–$2,080 region.
- Check out our free forex signals
- Follow the top economic events on FX Leaders economic calendar
- Trade better, discover more Forex Trading Strategies
- Open a FREE Trading Account
- Read our latest reviews on: Avatrade, Exness, HFM and XM