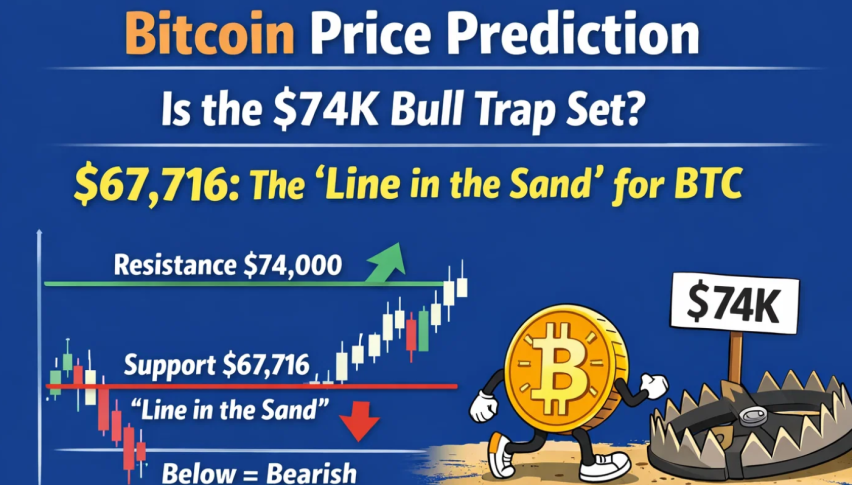
Bitcoin Price Prediction: Is the $74K Bull Trap Set? Why $67,716 is the “Line in the Sand” for BTC
The whole "Digital Gold" narrative is currently getting put through the wringer like never before. As of the Saturday, March 7, 2026...
Quick overview
- Bitcoin is currently trading between $67,900 and $68,200, down 4% in the last 24 hours after a mid-week rally peaked at $74,000.
- Despite bearish market signals, institutional investors are showing resilience, with significant inflows into ETFs and increased whale activity.
- Geopolitical tensions and a strong U.S. dollar are contributing to a challenging environment for Bitcoin, leading analysts to predict a potential bear market.
- The price is consolidating around $68,000, with key resistance at $70,048 and support levels at $67,716 and below.
The whole “Digital Gold” narrative is currently getting put through the wringer like never before. As of the Saturday, March 7, 2026, Bitcoin (BTC) is stuck between a rock and a hard place, hovering around $67,900 to $68,200, down a whoppin’ 4% over the last 24 hours.
After a pretty wild mid-week rally that saw BTC blast through $74,000, the market got hit with a serious “reality check” in the form of some not-so-good news on the geopolitical and macroeconomic fronts. The U.S.-Iran conflict is getting worse and the US dollar just saw its steepest weekly gain in a year, which left traders on Saturday asking: was the $74K surge for real, or was it just a high-pressure bull trap?
The “Death Cross” vs. Institutional Appetite
The picture for Bitcoin is getting pretty dark, but despite all that, the on-chain data is still showing that “Smart Money” is still very much in the game.
- The 3-Day Death Cross: A lot of market analysts are getting pretty worked up about a very historic Death Cross appearing on the 3-day chart. This formation – where the 50-day SMA crosses below the 200-day SMA – has in the past preceded final price draw downs of 50% or more.
- Institutional Resilience: Despite the price hit, BlackRock’s IBIT and other spot ETFs have been pretty rock solid. On March 2 alone, ETFs saw a whopping $458 million in net inflows, which is a sign that institutional investors are treating this volatility as a “generational accumulation” window.
- Whale Activity: Large-scale holders (wallets with 100,000 to 1,000,000 BTC) have added over 13,000 BTC since late February – a sign that those big players are not panicking.
Macro Mayhem: Operation Epic Fury and the Dollar Surge
Bitcoin is currently fighting off a “Triple Threat” of macro factors that are draining liquidity from risk assets.
- Geopolitical Risk-Off: The escalation of the U.S.-Iran war is sending oil prices towards $90 per barrel, and that’s fueling global inflation fears. In this super “Extreme Fear” environment, investors are opting for the U.S. Dollar (DXY) and Physical Gold ($5,400/oz) over altcoins and BTC.
- The NFP “Stagflation” Trap: Friday’s Non-Farm Payrolls (NFP) report showed an unexpected dip in employment, but paradoxically that’s strengthening the Dollar as markets are bracing for a potential “hard landing” for the U.S. economy.
- The Bear Market Consensus: Analysts at ZX Squared Capital now say Bitcoin is “convincingly” in a bear market, with a potential 30% downside target still on the table for 2026.
Bitcoin Price Analysis: $68K Holds as Ascending Trendline Tightens Range
On the 4-hour chart, Bitcoin is compressing right around $68,000, which is looking a lot like a boxing match – tough to get out of this range until one side gives up. It’s stuck between a solid horizontal resistance at $70,048 and a rising trendline support originating from the $62,000 low. This structure is showing a very tightening range, with higher lows forming but the price struggling to break back above $68,600-68,800 EMA cluster.
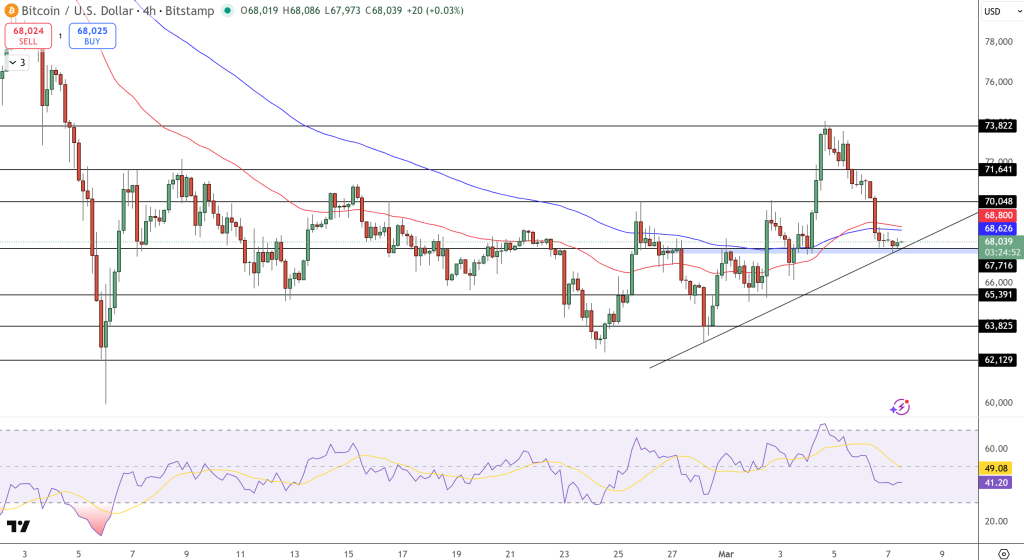
The 50 EMA is trying to curl back up near $68,799, while the 100 EMA is still sitting on top at around $68,625, acting as enough of a barrier to keep the price down. A clean close above this zone would be a big thumbs up for the buyers, but for now, the price is stuck with risk above $70,048. Immediate resistance stands at $70,048, then $71,641 and $73,822.
On the downside, $67,716 is a pretty serious intraday support level, with stronger structure at $65,391 and $63,825 if the ascending trendline fails. RSI has cooled off a bit to the low-40s, suggesting momentum reset rather than a full-on bearish continuation.
As long as Bitcoin holds above the rising trendline, the bias is neutral-to-bullish. A breakout above $70,048 would likely open the way for the price to shoot up towards $71,600-$73,800.
The Analyst’s Verdict: A High-Risk Consolidation Phase
As a professional analyst, I see a pretty weird “Utility Paradox” at play here. The market structure is bearish, but the institutional accumulation is still super high. We are likely entering a period of high-risk consolidation that’s likely to end in a big move, one way or the other.
Trade Idea: Avoid super aggressive long positions until we get a clean close above $70,048.
Short Bias: Be on the lookout for a breakdown below $67,700 to target $65,400.
Stop Loss: Set above $69,100.
- Check out our free forex signals
- Follow the top economic events on FX Leaders economic calendar
- Trade better, discover more Forex Trading Strategies
- Open a FREE Trading Account
- Read our latest reviews on: Avatrade, Exness, HFM and XM
Related Articles